Difference between revisions of "Generating Performance Plot & Automating the Process"
| Line 5: | Line 5: | ||
Performance plot helps consolidate all possible data required and outputs them in a line graph image. | Performance plot helps consolidate all possible data required and outputs them in a line graph image. | ||
It is a graphical rendering of statistical data based on performance log’s different aspects such as, Process Age, Virtual memory usage, CPU & Memory Usage | It is a graphical rendering of statistical data based on performance log’s different aspects such as, Process Age, Virtual memory usage, CPU & Memory Usage, Client thread in use, waiting and spare, Total Memory consumption, Load Average, etc | ||
Helps you | Helps you understand how proxy behavior under load by comparing plots generated before. | ||
It is very helpful during the troubleshooting process; plot contains all system resources information and connection details | It is very helpful during the troubleshooting process; plot contains all system resources related information and connection details such as Total connections created, Number of concurrent connections handle by the server, which have other wise took you multiples commands for gathering the same information. | ||
Example use-case: For issues related with system resources or in situations where we notice increased load average, then using performance plot you can identify the root cause of the problem. | |||
Example use case: For issues related with system resources or in situations where we notice increased load average, then using performance plot you can identify the root cause of the problem. | |||
= Default Process of Creating Performance Plot = | = Default Process of Creating Performance Plot = | ||
Revision as of 16:17, 6 January 2023
What is Performance Plot
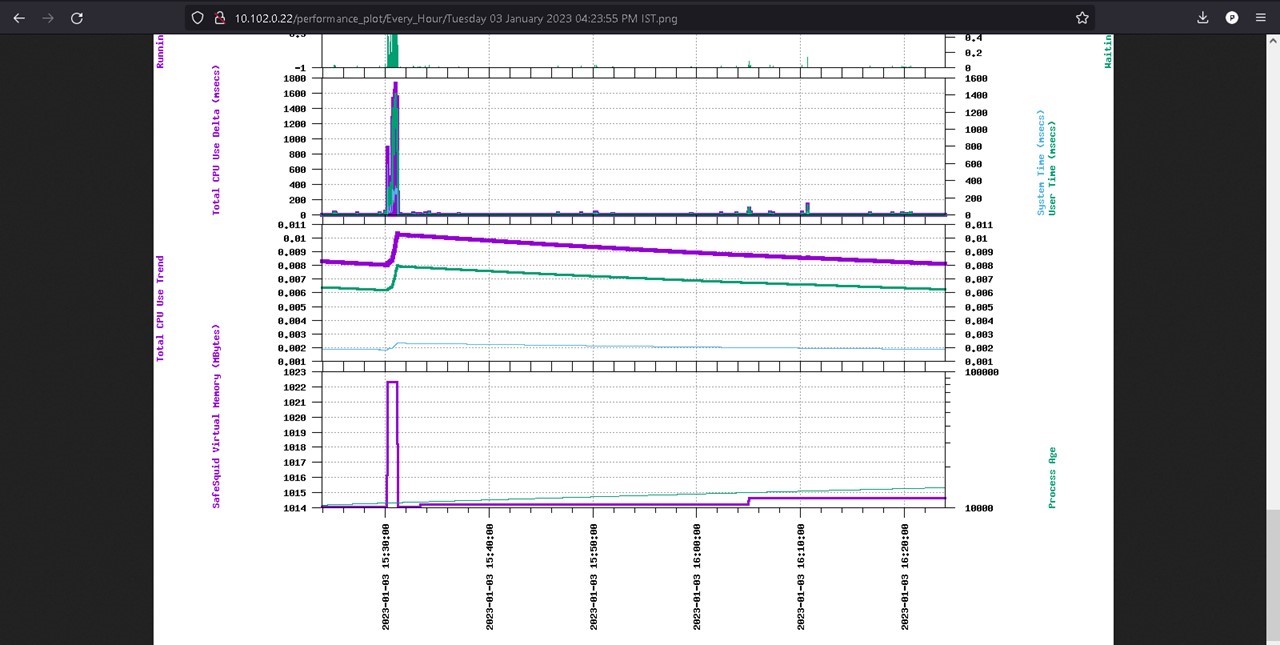
Plot is a convenient way of visually displaying the data collected by SafeSquid’s performance log.
Performance plot helps consolidate all possible data required and outputs them in a line graph image.
It is a graphical rendering of statistical data based on performance log’s different aspects such as, Process Age, Virtual memory usage, CPU & Memory Usage, Client thread in use, waiting and spare, Total Memory consumption, Load Average, etc
Helps you understand how proxy behavior under load by comparing plots generated before.
It is very helpful during the troubleshooting process; plot contains all system resources related information and connection details such as Total connections created, Number of concurrent connections handle by the server, which have other wise took you multiples commands for gathering the same information.
Example use-case: For issues related with system resources or in situations where we notice increased load average, then using performance plot you can identify the root cause of the problem.
Default Process of Creating Performance Plot
SafeSquid’s web interface http://safesquid.cfg has an option to generate performance plot using time frequency.
Performance plot generated from SafeSquid’s web interface is snail paced and if selected time frequency contains loads of user log data, then generation time can take forever.
This can cause delay in critical troubleshooting process.
Automating plot generation based on set time intervals is not possible from web interface, example: plots to be generate every 1 hours or every day is not possible from web interface.
Performance plots generated from SafeSquid’s CLI is a better option as the generation time is comparatively lower than plots generate via SafeSquid’s web interface.
However, for using this script you will be needing to provide argument which are start time and end time using environment variables.
Getting required start time and end time can sometimes be challenging as the timestamp used in performance log is not easy to understand.
Creating Performance Plot using genPlot.sh Script
Using genPlot.sh, creation of performance plots is automated and based on set time intervals genPlot.sh generates performance plots and stores in appropriate folder.
Monit helps to automated the process of generating performance plot on custom frequency.
Note: Generation of performance plot for past 1 hour takes about 7-8 minutes using genPlot.sh script Example: You can generate performance plot every 1 hour, day, week, fortnight, month, year
You can also use genPlot.sh as a standalone script to generate reports as required.
Automating the Process of Performance Plot Creation
To automate the process of plot creation on custom time follow below steps:
Installation
Download the genPlot.tar.gz file
wget https://<Download Location> -O /tmp/ ; tar -xzvf /tmp/genPlot.tar.gz -C /usr/local/src/
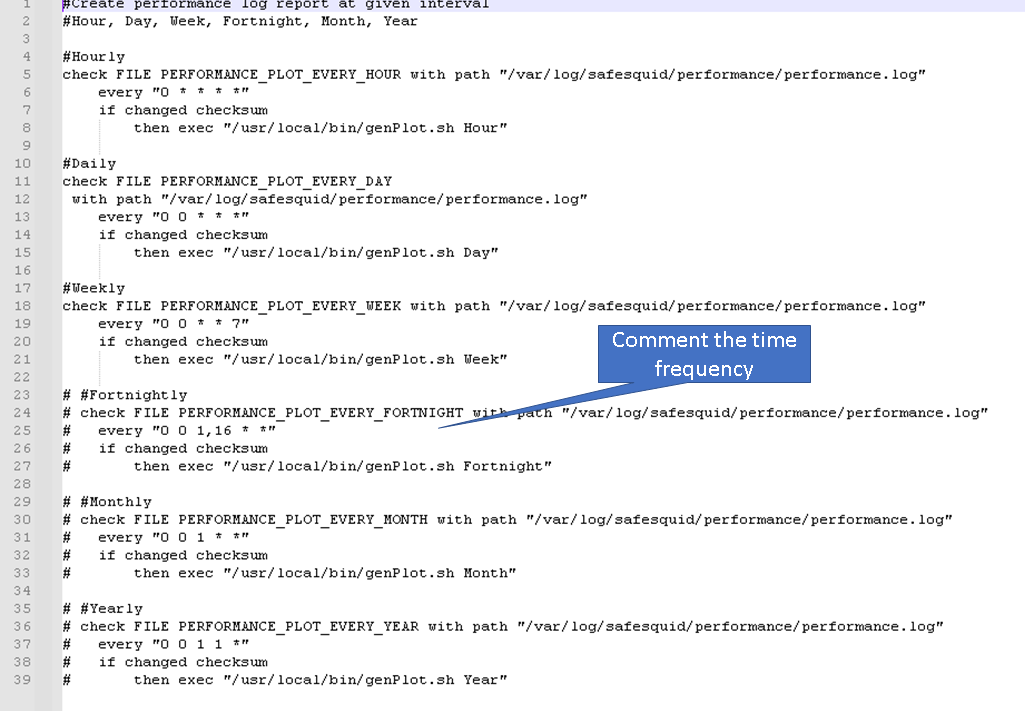
Edit plot.monit file and comment the time frequency which will not be used to generate plot
After updating copy plot.monit file to /etc/monit/conf.d/
cp /usr/local/src/plot.monit /etc/monit/conf.d/
Copy genPlot.sh script to /usr/local/bin/
cp /usr/local/src/genPlot.sh /usr/local/bin/
Add execute permissions
chmod 755 /usr/local/bin/genPlot.sh
Check the Monit control file and reload Monit
monit -t && monit reload
Performance plot will be generated every hour, day and week as per our plot.monit file.
Validating
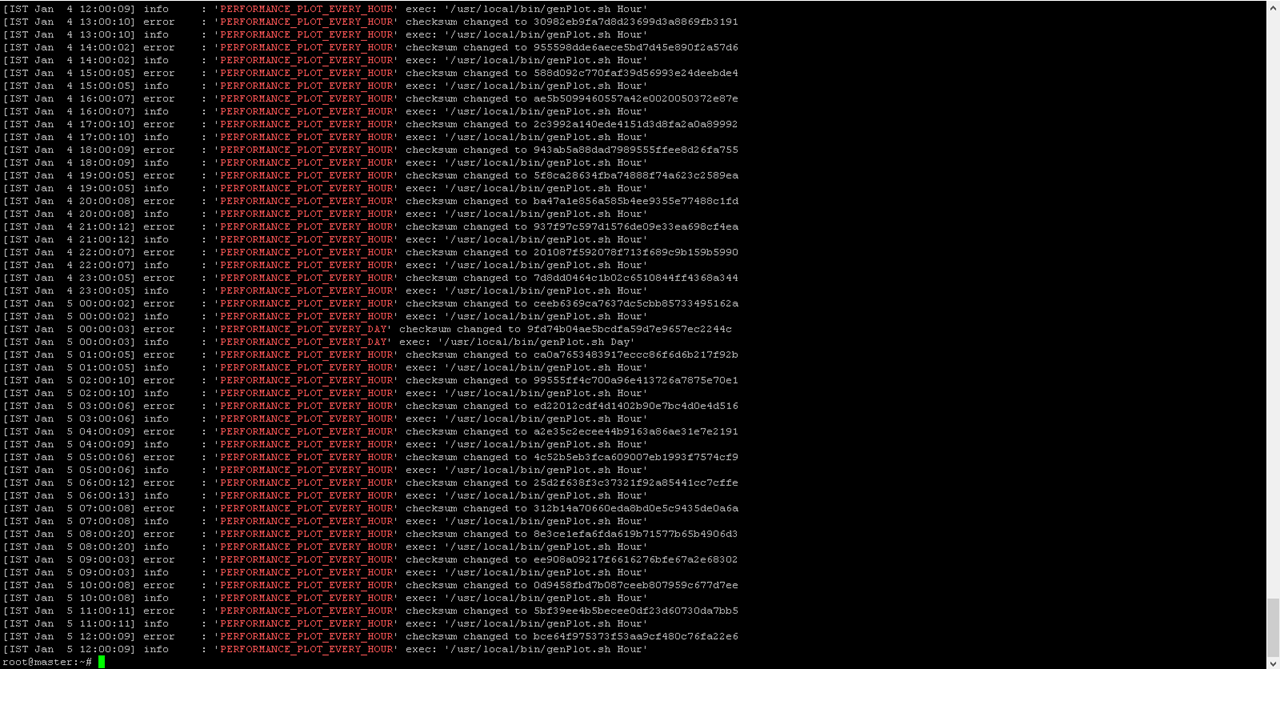
To view the logs for plot creation check your /var/log/monit.log file
Note: Do not check for logs immediately after setting up the scripts, wait for at least couple of hours and then check for logs
grep -E "PERFORMANCE_PLOT_EVERY_(HOUR|DAY|WEEK)" /var/log/monit.log
How to view generated plots
Using a Web-Server
To view generate plot in your browser install Apache web server.
To install Apache web server run below command
apt install apache2
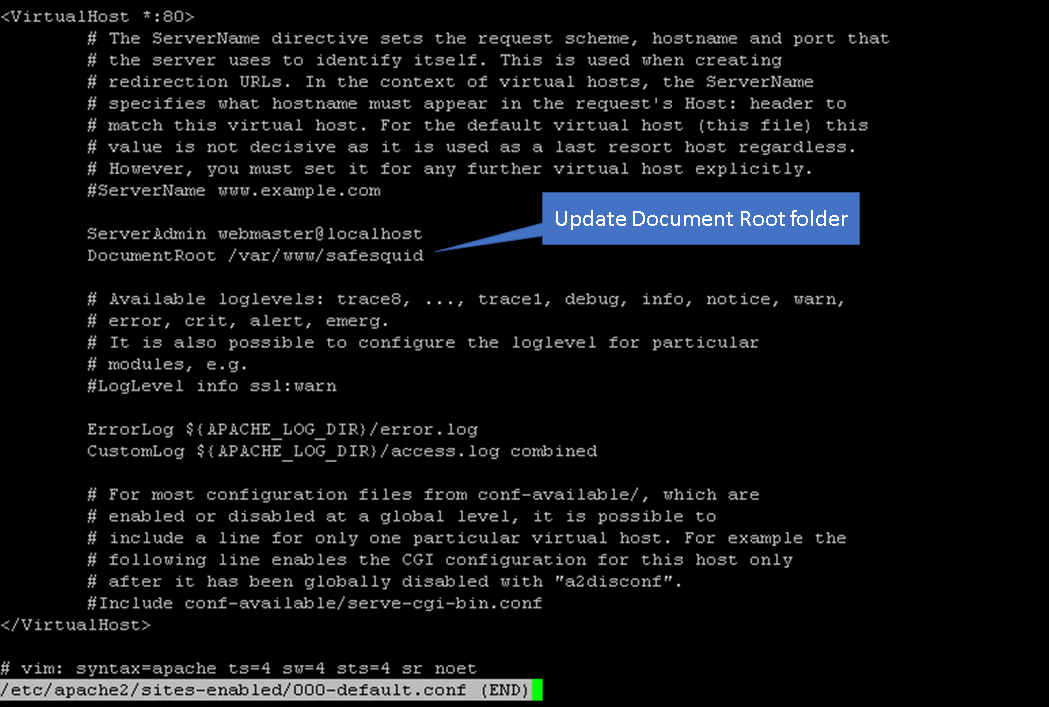
edit the /etc/apache2/sites-enabled/000-default.conf
vim /etc/apache2/sites-enabled/000-default.conf
Update the document root from /var/www/html to /var/www/safesquid
Now reload the site configurations using below command
a2dissite 000-default.conf && systemctl reload apache2 && a2ensite 000-default.conf && systemctl reload apache2
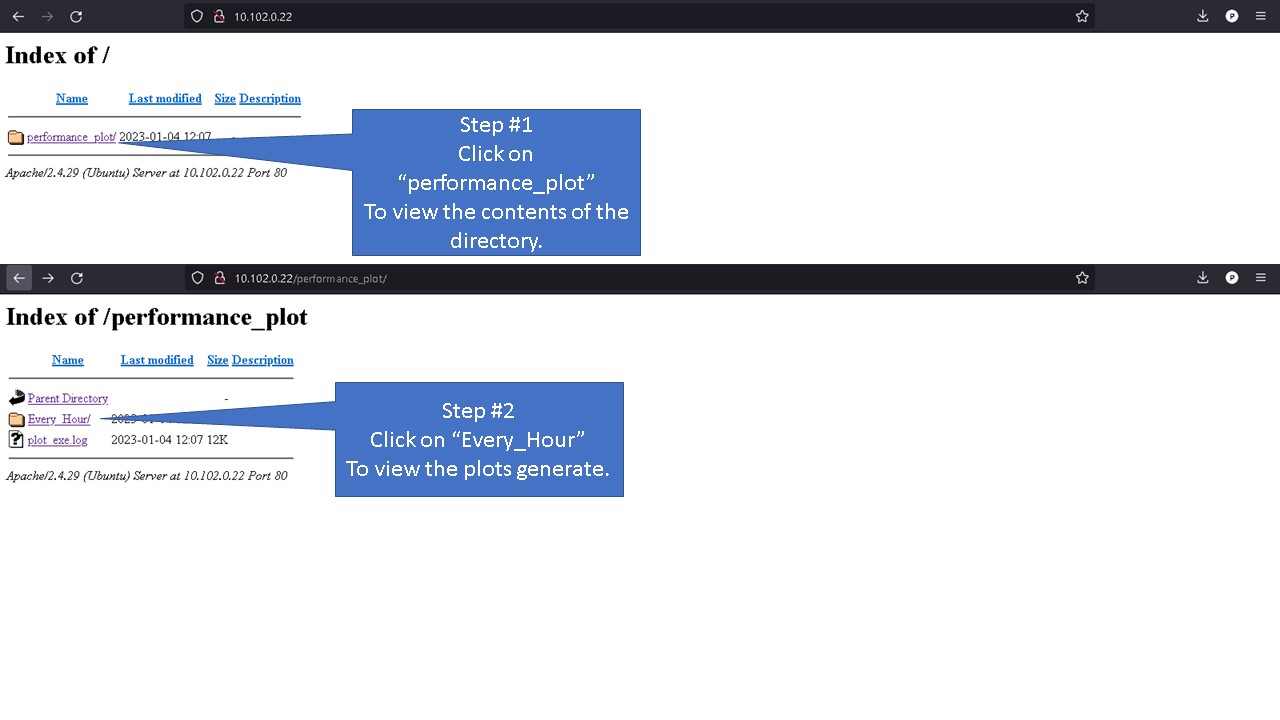
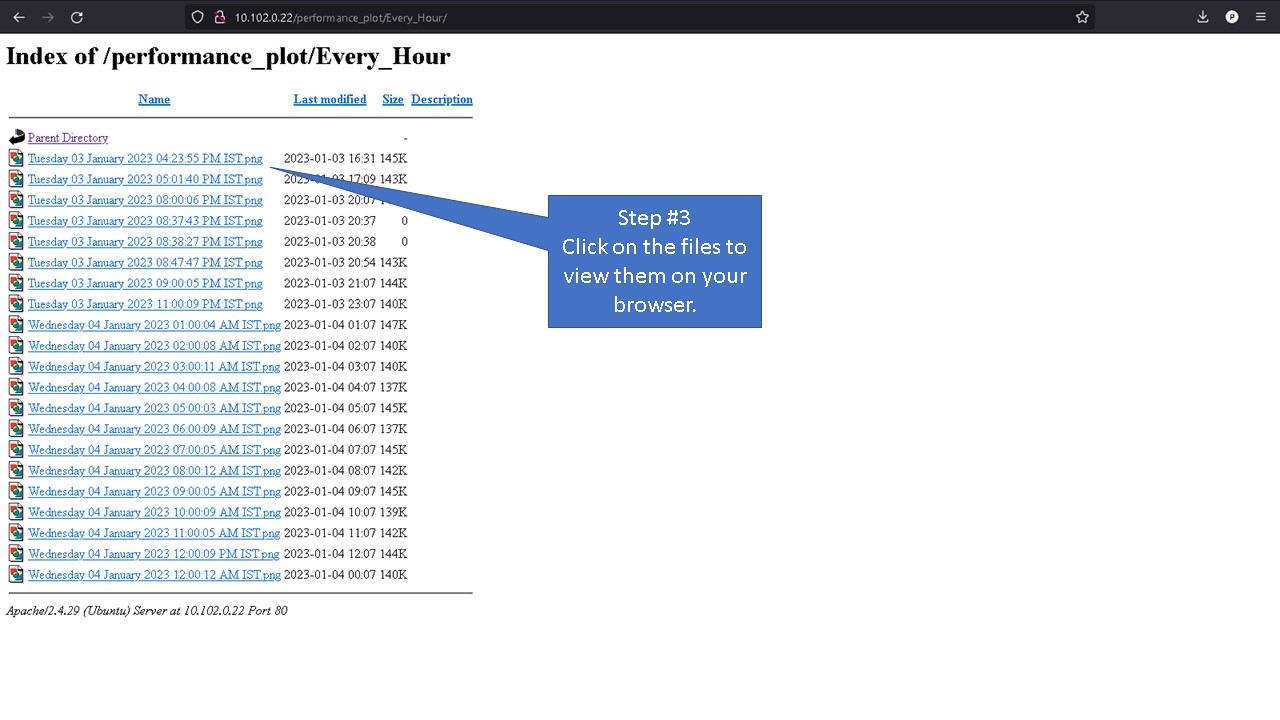
Now open your browser access the webserver using servers IP address
On a local Machine
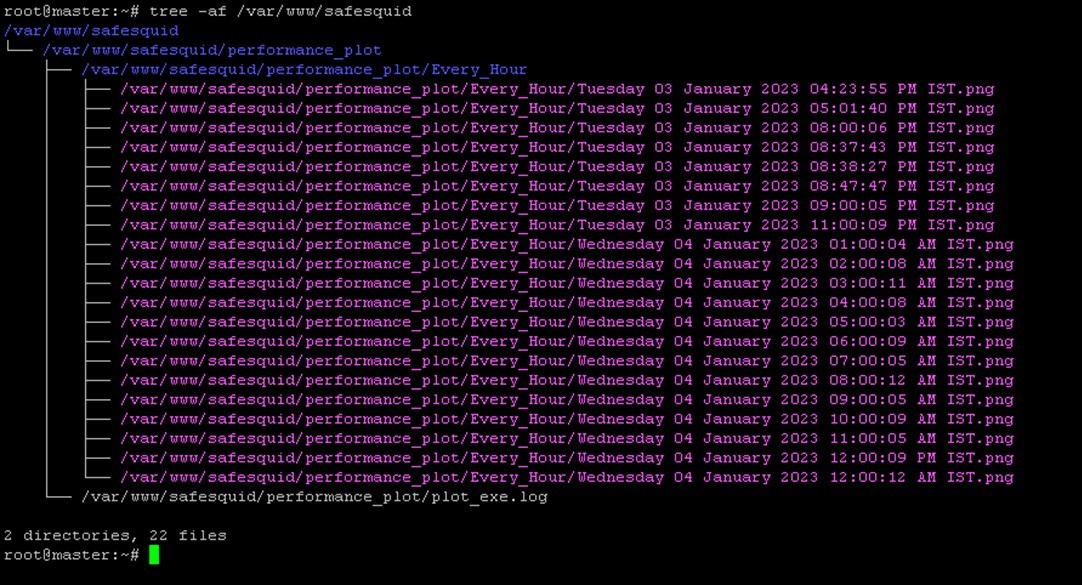
For users without a webserver, you can access the generated performance plot from /var/www/safesquid/performance_plot location.
To view all plots created run below command.
tree -af /var/www/safesquid
Based on the frequency set you can access the folder and view your performance log.
For example: users who have set Monit to configure plot every hour will find the performance plot to be located inside folder Every_Hour
Copy the files to your location machine and using any image view you can view your performance plots.
Generate plot as required
Usage
To generate report as required run command
 genPlot.sh <options>
 Options: Hour, Day, Week, Fortnight, Month, Year
 Example: genPlot.sh Hour
This will generate plot of last 1 hour
