> ## Documentation Index
> Fetch the complete documentation index at: https://docs.safesquid.com/llms.txt
> Use this file to discover all available pages before exploring further.
# Reporting Module
> Use SafeSquid reporting to investigate activity, drill into users and destinations, and export time-bounded evidence for operations and audit review.
# Turn dashboard data into evidence
## Problem statement
Dashboards often look useful while failing real investigations. If operators cannot move from a chart to a specific user, destination, policy event, and time window, reporting becomes presentation material instead of operational evidence.
## Client scenario
Use the Reporting Module when you need to:
* investigate a user, group, destination, or policy outcome quickly
* prove activity during a specific time window
* export evidence for audit, management review, or incident response
* tune policy from observed traffic instead of assumptions
## Key benefits
The Reporting Module provides a fast investigation surface for recent activity and a practical way to narrow from summary view to specific transactions. It complements raw logs by helping operators identify where to look and what to export.
## Prerequisites
### Client-side preparations
* Know the user, group, destination, or incident window you want to investigate.
* Confirm the traffic of interest actually passed through SafeSquid.
### SafeSquid-side setup
* Ensure dashboard reporting is available and receiving current data.
* Use raw logs as the fallback source when the dashboard view is too narrow or a time window must be validated precisely.
## Setup instructions
### Start from the dashboard view
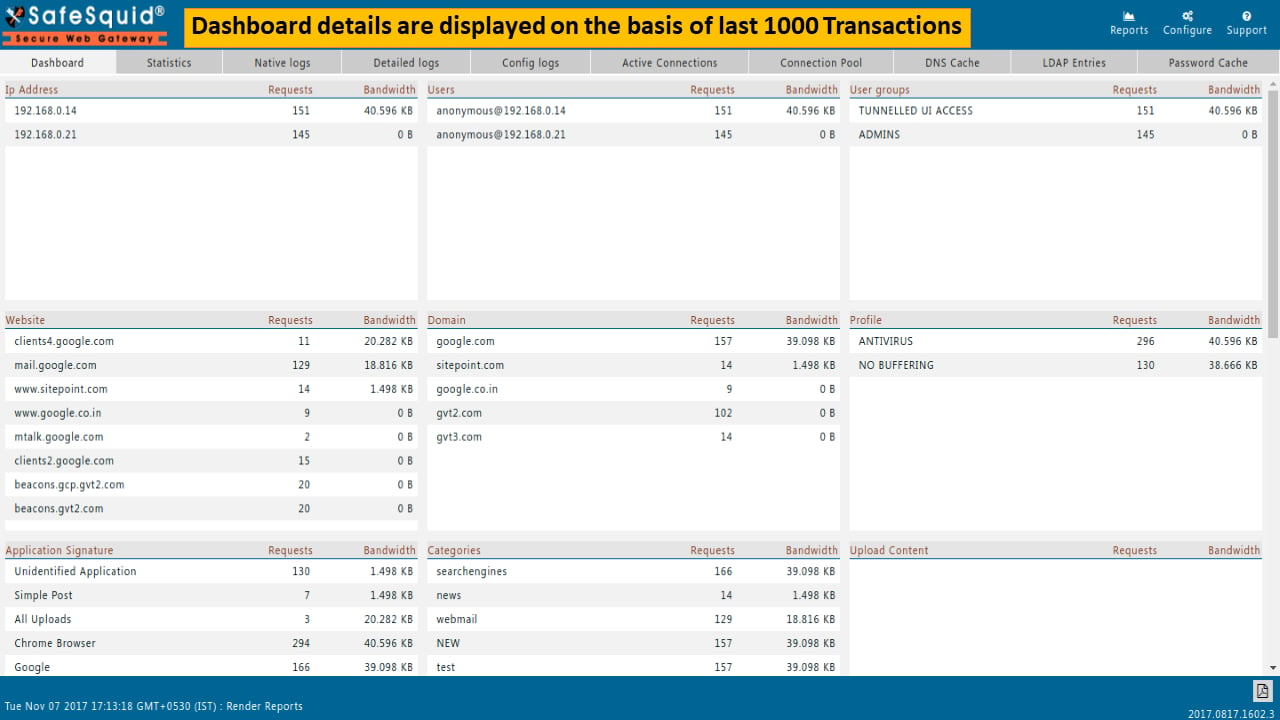
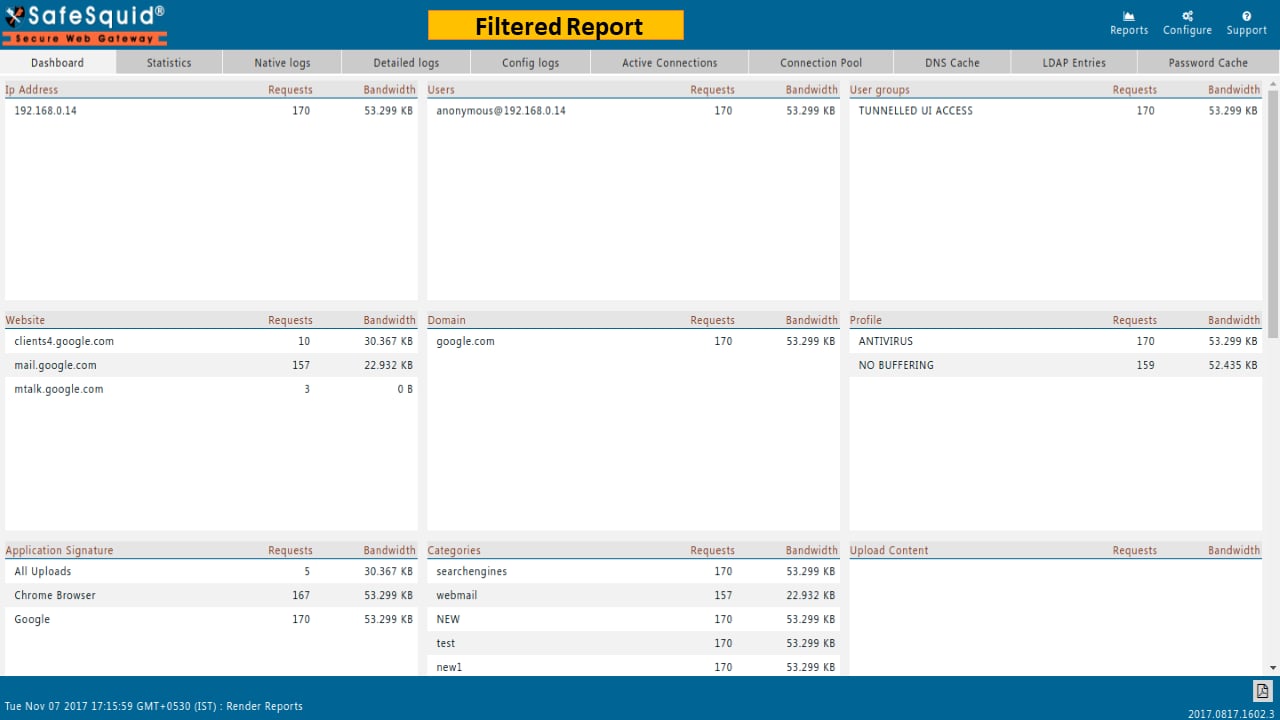
Open **Reports → Dashboard** and review the current report scope.
Dashboard data defaults to recent transactions, so begin by deciding whether you need transaction-count scope or date-range scope.
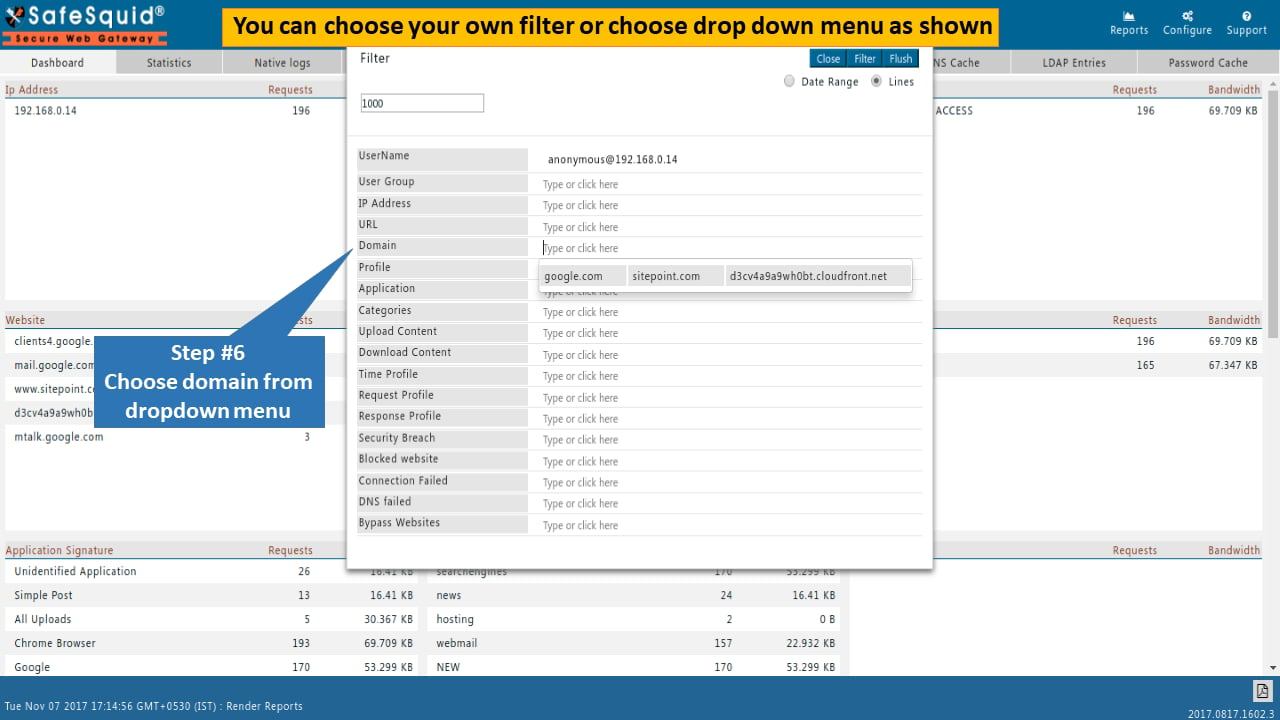
### Drill into the first reliable signal
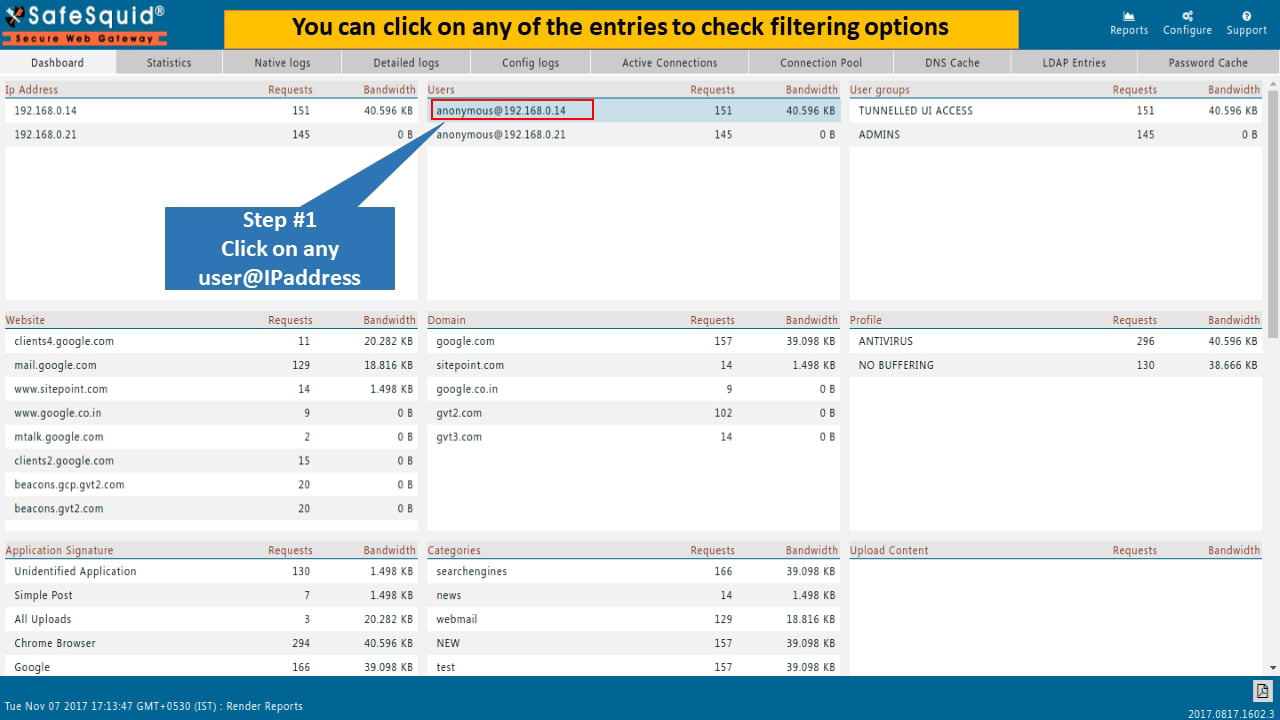
Click a useful entry such as:
* user name
* user group
* IP address
* domain
* blocked websites
* security breaches
* categories
* application signatures
Choose the first filter that is least ambiguous for the incident you are investigating.
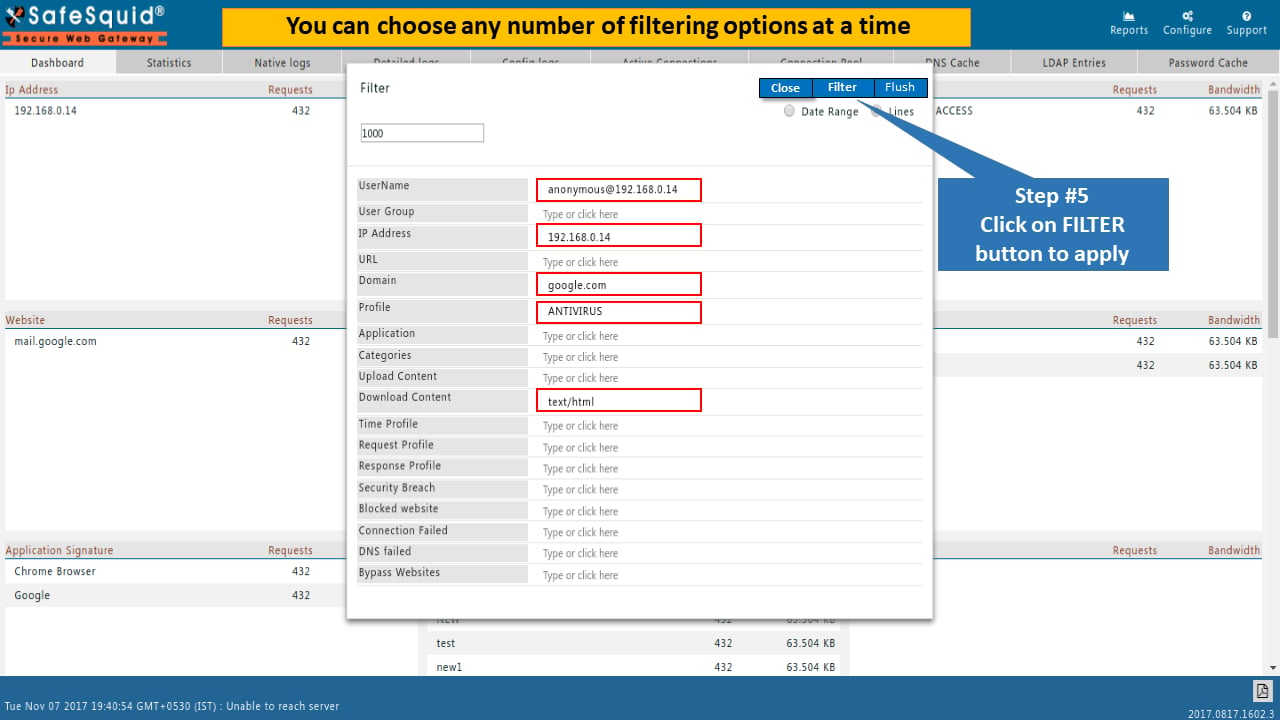
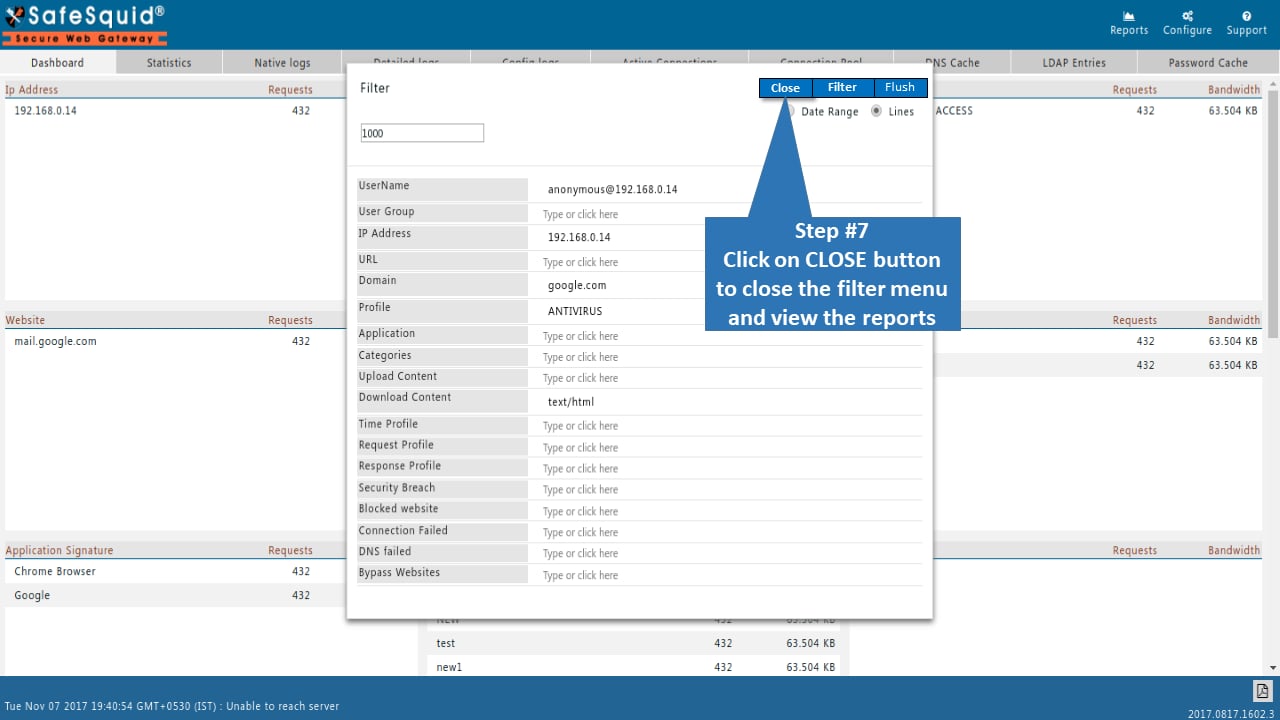
 ### Adjust the transaction range when needed
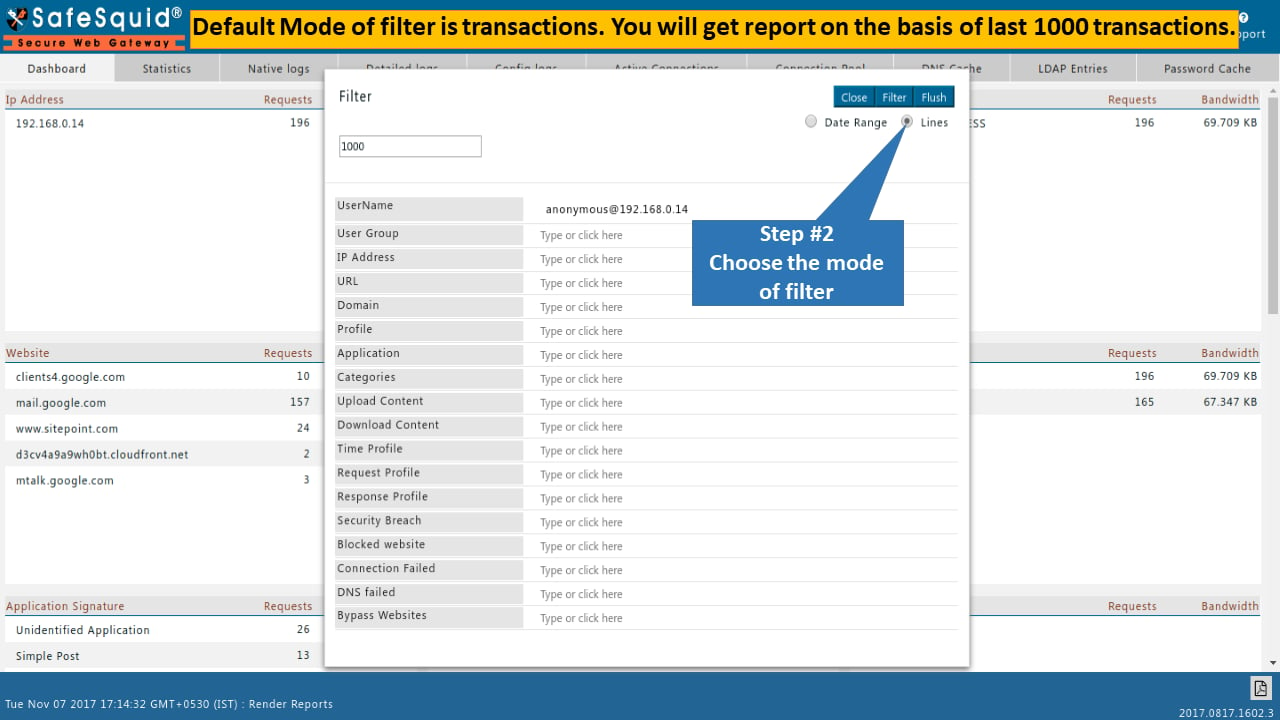
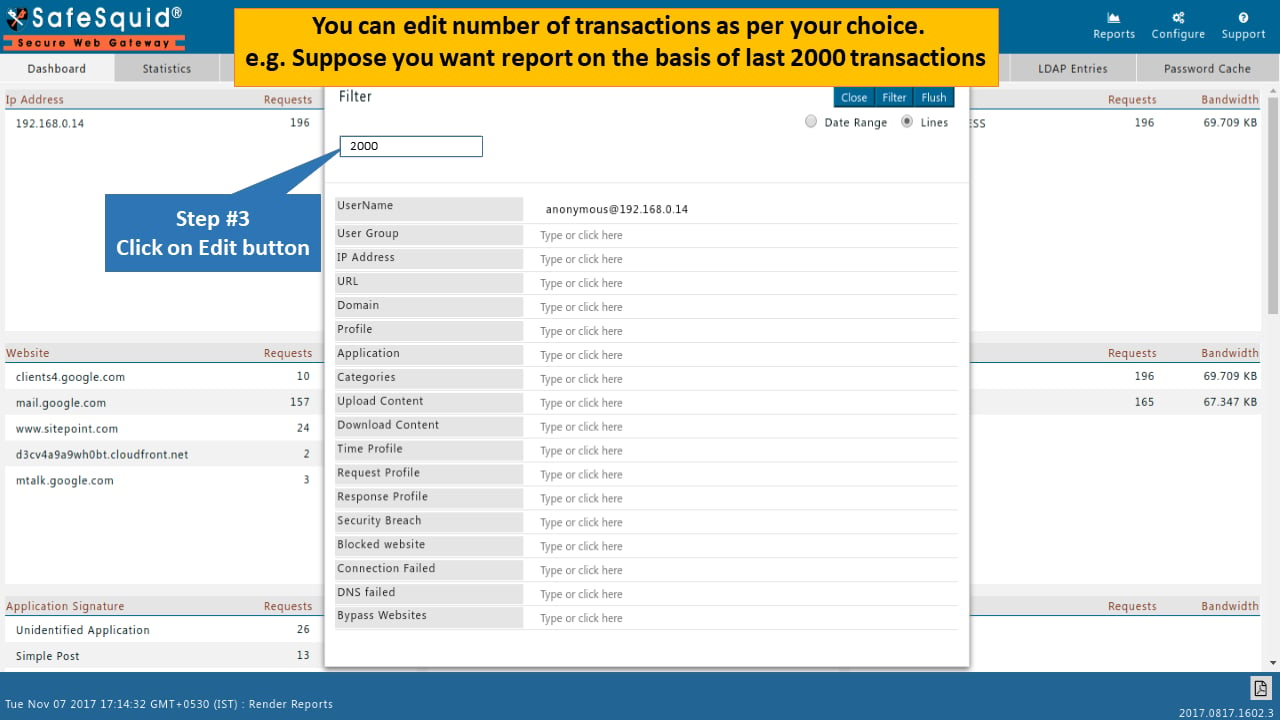
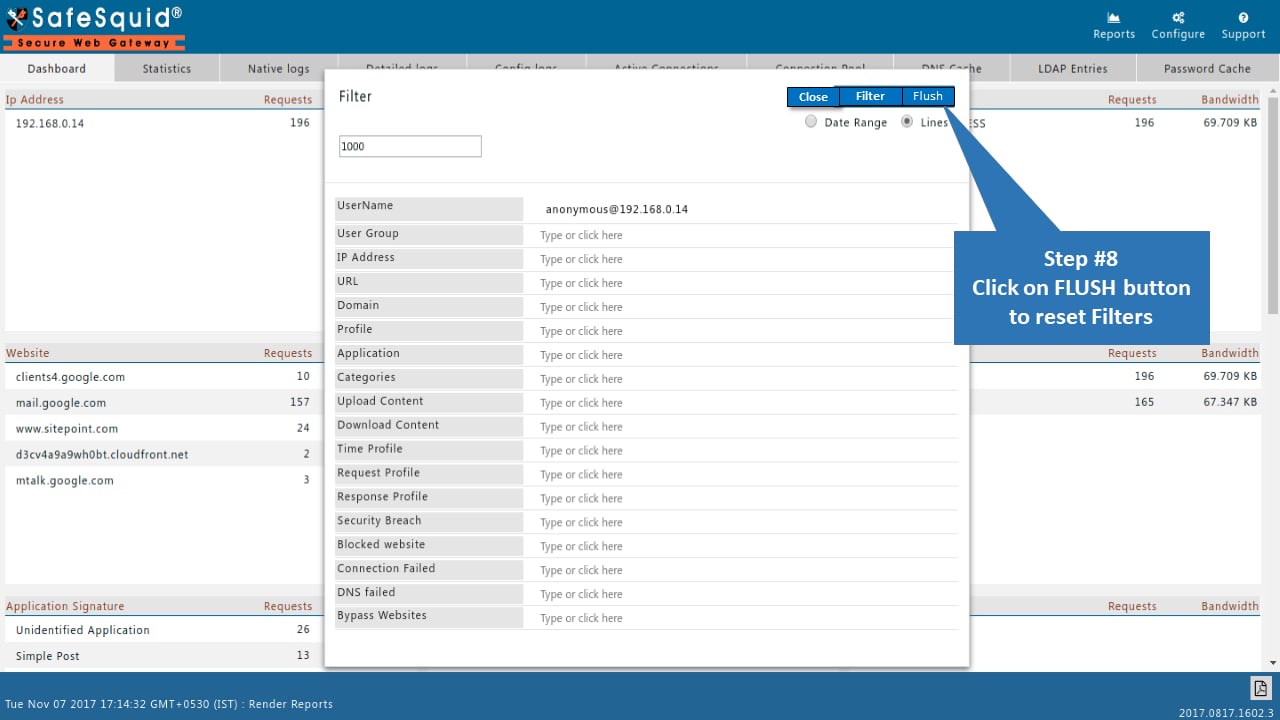
SafeSquid reports on a recent transaction set by default. Increase or narrow the range based on the event you are investigating.
### Adjust the transaction range when needed
SafeSquid reports on a recent transaction set by default. Increase or narrow the range based on the event you are investigating.
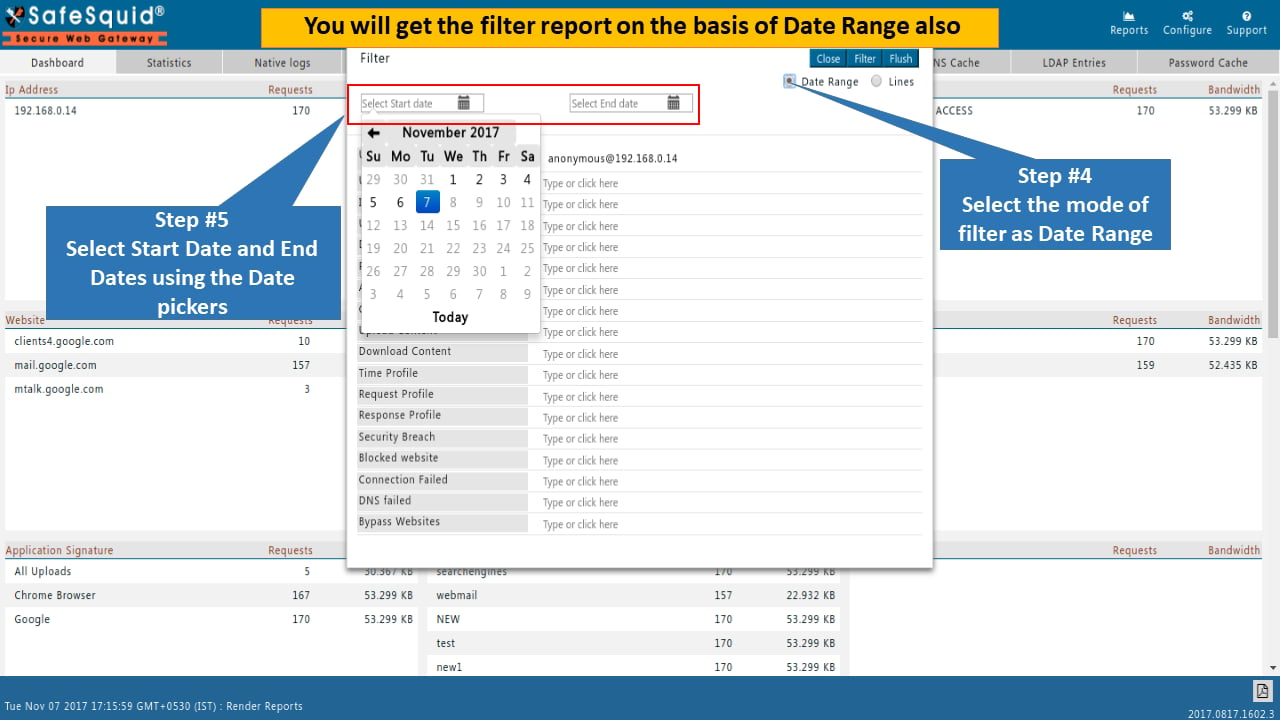
 ### Switch to date-range evidence for incident review
When the event belongs to a known time window, use the date-range filter instead of relying only on the recent transaction view.
### Switch to date-range evidence for incident review
When the event belongs to a known time window, use the date-range filter instead of relying only on the recent transaction view.
 ### Export what you prove
When the report reflects the correct user, activity, and time range, export the result for review or audit use.
## Verification and validation
### Positive test
Trigger a controlled request, then locate it through the dashboard using a user, IP, or destination filter.
Expected result:
* the event appears in the reporting window
* drill-down narrows the result to the intended transaction set
* the exported report reflects the same filtered evidence
### Negative test
Search for a user or destination that should not appear in the chosen time window.
Expected result:
* the report remains empty or excludes that activity
* operators do not mistake stale or unrelated data for current evidence
### Evidence to retain
* the exact filter path used
* the time range or transaction range selected
* the exported report file
* any corresponding log query used to corroborate the finding
## Troubleshooting guide
### Expected activity is missing from the dashboard
Likely causes:
* the report scope is too narrow
* the filters are too restrictive
* the activity did not pass through the expected SafeSquid path
Isolation steps:
* reset filters
* widen the transaction range or date range
* compare against raw logs
Remediation:
* correct the scope
* validate the traffic path
* rerun the report with a narrower filter only after the event is visible
### The dashboard shows activity, but it is not precise enough for evidence
Likely causes:
* operators are stopping at summary widgets
* the transaction window is too broad
* raw log corroboration was skipped
Isolation steps:
* drill down by a more specific field
* reduce the time range
* compare the same event against logs
Remediation:
* preserve both the report export and the supporting log reference
* use the dashboard to find the event, then use logs to prove it precisely
## Related controls / next steps
* Use [Security Logs](/Security_Logs) for raw evidence and deep investigation.
* Use [Performance Plot](/Performance_Plot) for time-based load and capacity context.
## Related topics
- [Audit & Forensics](/use_cases/audit_and_forensics/audit_forensics.md)
- [Troubleshooting](/troubleshooting/troubleshooting.md)
- [Compliance Templates](/use_cases/access_restriction/compliance_templates.md)
- [Security Logs](/use_cases/audit_and_forensics/security_logs.md)
- [Access Restriction](/use_cases/access_restriction/access_restriction.md)
### Export what you prove
When the report reflects the correct user, activity, and time range, export the result for review or audit use.
## Verification and validation
### Positive test
Trigger a controlled request, then locate it through the dashboard using a user, IP, or destination filter.
Expected result:
* the event appears in the reporting window
* drill-down narrows the result to the intended transaction set
* the exported report reflects the same filtered evidence
### Negative test
Search for a user or destination that should not appear in the chosen time window.
Expected result:
* the report remains empty or excludes that activity
* operators do not mistake stale or unrelated data for current evidence
### Evidence to retain
* the exact filter path used
* the time range or transaction range selected
* the exported report file
* any corresponding log query used to corroborate the finding
## Troubleshooting guide
### Expected activity is missing from the dashboard
Likely causes:
* the report scope is too narrow
* the filters are too restrictive
* the activity did not pass through the expected SafeSquid path
Isolation steps:
* reset filters
* widen the transaction range or date range
* compare against raw logs
Remediation:
* correct the scope
* validate the traffic path
* rerun the report with a narrower filter only after the event is visible
### The dashboard shows activity, but it is not precise enough for evidence
Likely causes:
* operators are stopping at summary widgets
* the transaction window is too broad
* raw log corroboration was skipped
Isolation steps:
* drill down by a more specific field
* reduce the time range
* compare the same event against logs
Remediation:
* preserve both the report export and the supporting log reference
* use the dashboard to find the event, then use logs to prove it precisely
## Related controls / next steps
* Use [Security Logs](/Security_Logs) for raw evidence and deep investigation.
* Use [Performance Plot](/Performance_Plot) for time-based load and capacity context.
## Related topics
- [Audit & Forensics](/use_cases/audit_and_forensics/audit_forensics.md)
- [Troubleshooting](/troubleshooting/troubleshooting.md)
- [Compliance Templates](/use_cases/access_restriction/compliance_templates.md)
- [Security Logs](/use_cases/audit_and_forensics/security_logs.md)
- [Access Restriction](/use_cases/access_restriction/access_restriction.md)