> ## Documentation Index
> Fetch the complete documentation index at: https://docs.safesquid.com/llms.txt
> Use this file to discover all available pages before exploring further.
# Performance Plot
> Generate SafeSquid performance plots to investigate load, capacity, and timing issues with evidence that supports troubleshooting and operations review.
# Turn performance data into operating evidence
## Problem statement
When a team reports slowness, instability, or unexplained capacity pressure, screenshots of the dashboard are not enough. Operators need a time-bounded view of performance behavior so they can correlate complaints with actual load and investigate the correct incident window.
## Client scenario
Use Performance Plot when you need to:
* inspect SafeSquid load during a specific incident window
* compare current behavior with expected performance trends
* gather evidence for capacity review or escalation
* preserve a visual record of performance before and after a change
## Key benefits
Performance plots help operations teams move from vague complaints to measurable time-based evidence. They are especially useful during incident review, change validation, and capacity planning discussions.
## Prerequisites
### Client-side preparations
* Know the approximate time window of the event you are investigating.
* Confirm the issue really occurred through the SafeSquid path you want to analyze.
### SafeSquid-side setup
* Ensure the Support interface is accessible.
* Confirm the underlying performance logging path is active.
## Setup instructions
### Open the performance plot tool
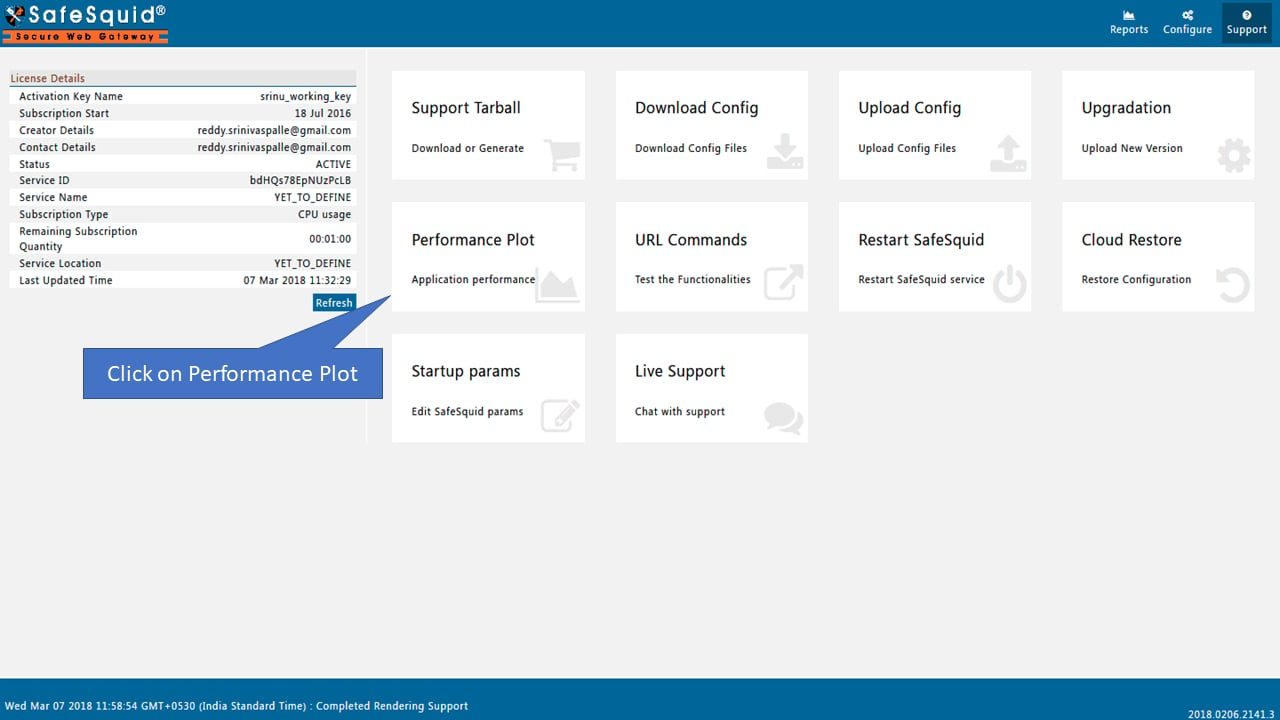
Access the [Configuration Portal](/Configuration_Portal), then open **Support** and locate the performance plot function.
### Select the right time range
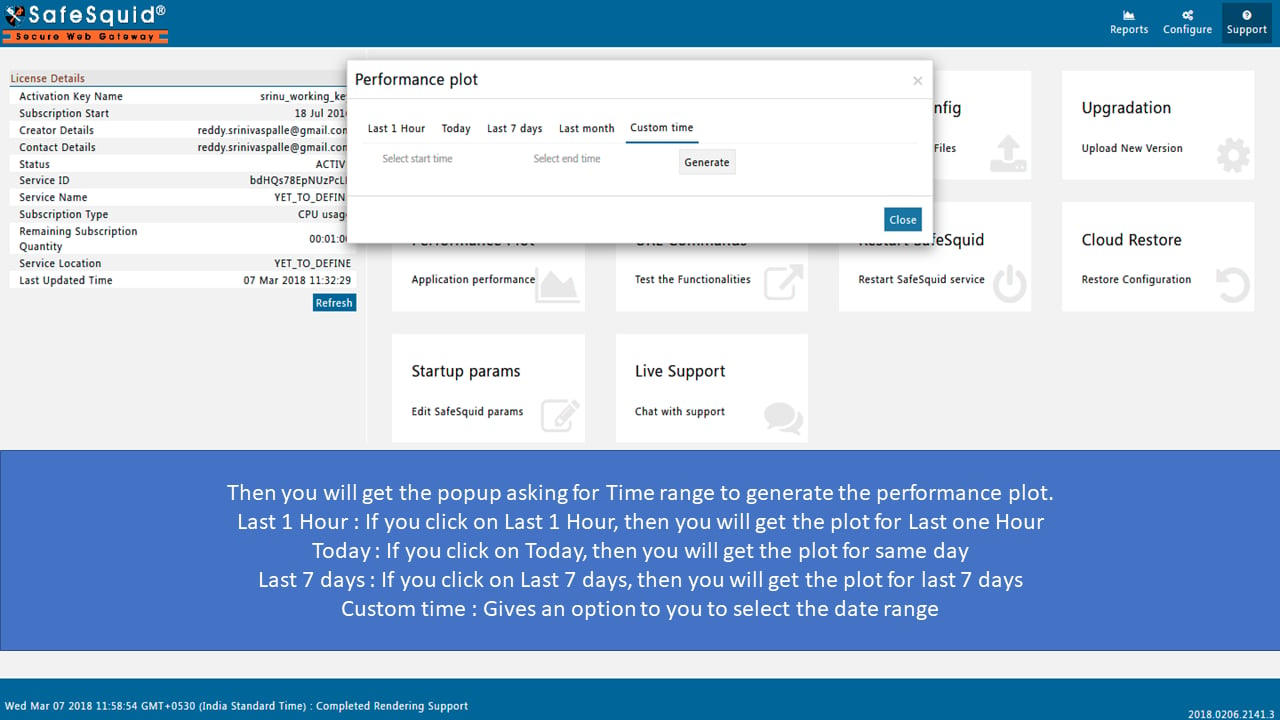
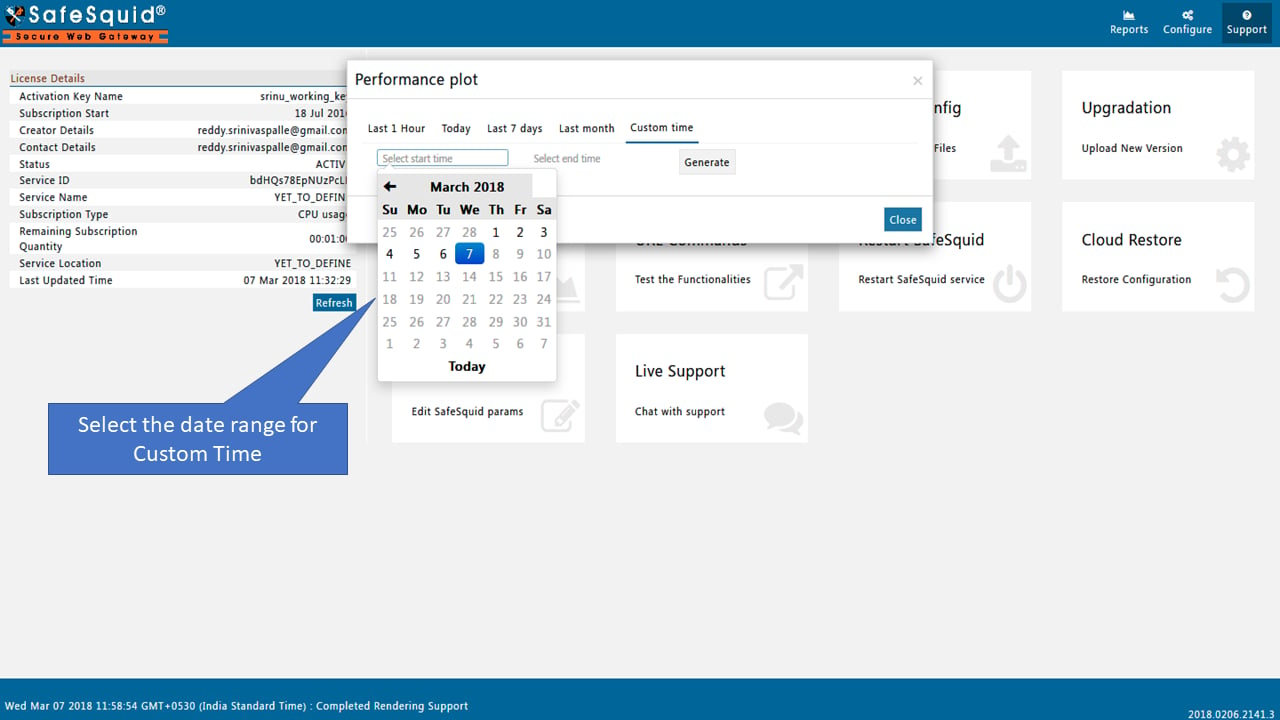
Choose the time range that matches the incident or observation window. If the issue lasted only a short period, use a tight time range first.
This reduces noise and makes the plot easier to interpret.
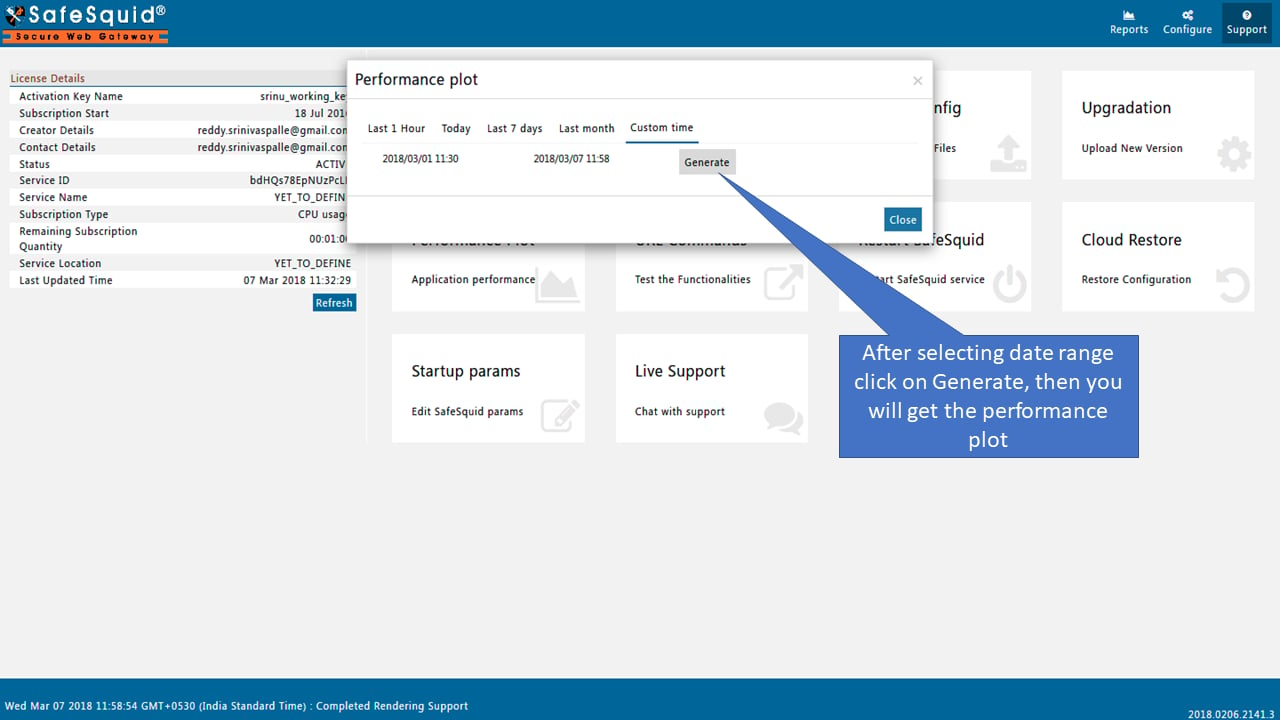
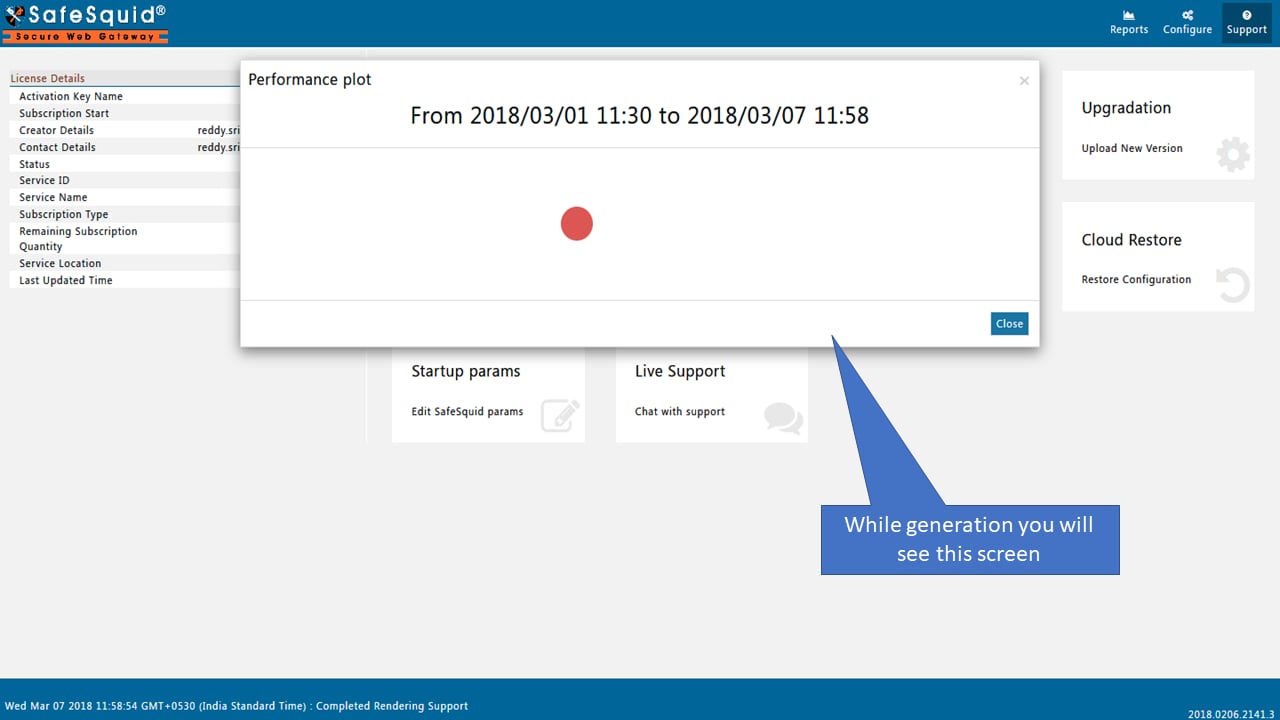
### Generate the plot
Run the plot generation action from the interface after selecting the desired window.
 ### Save the generated evidence
Save the plot when it captures a useful incident or baseline window.
### Save the generated evidence
Save the plot when it captures a useful incident or baseline window.
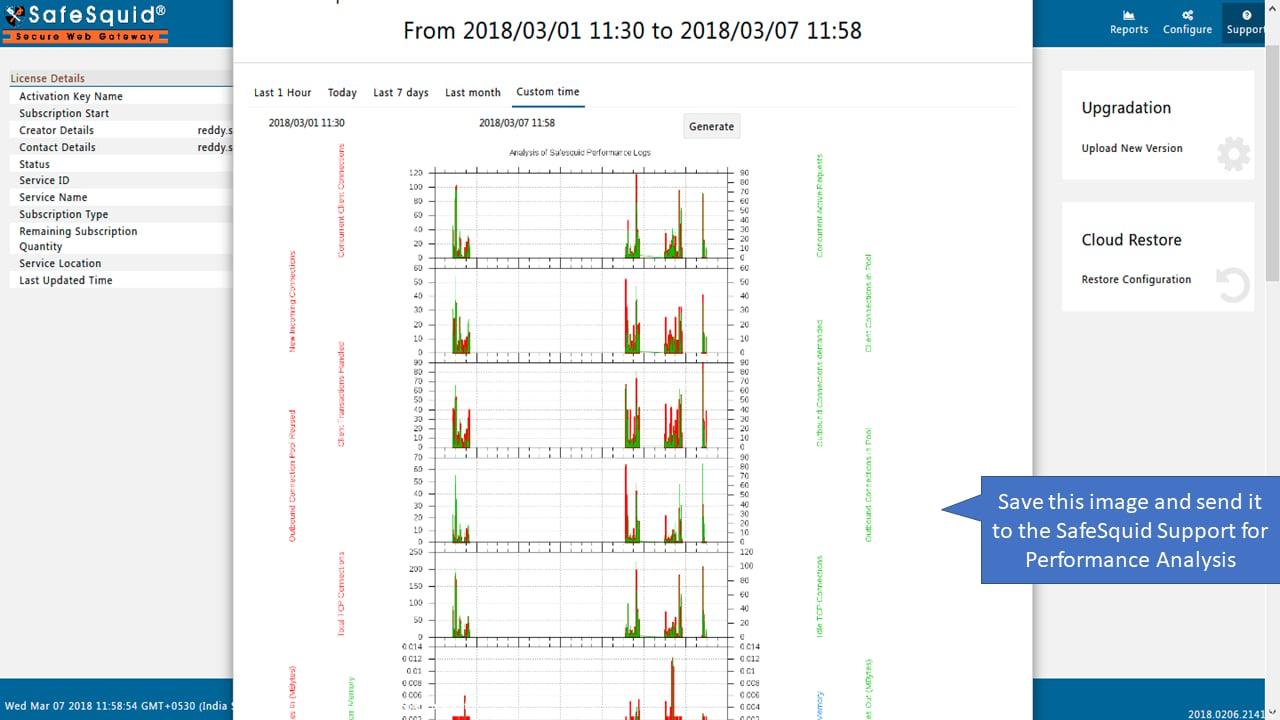 This helps with later comparison, escalation, and post-incident review.
## Verification and validation
### Positive test
Generate a plot for a known busy period.
Expected result:
* the plot renders successfully
* the chosen time window matches the requested period
* the output is usable for operational review
### Negative test
Generate a plot for a quiet period or a very narrow window with little traffic.
Expected result:
* the plot still renders
* low activity is visible as low activity, not as a tool failure
### Evidence to retain
* the selected time range
* the saved plot file
* any related incident ticket or change reference
## Troubleshooting guide
### The plot does not generate
Likely causes:
* the plotting dependency or script path is broken
* the selected range has a tooling or data issue
Isolation steps:
* compare the behavior against the dedicated troubleshooting runbook
* verify whether other support functions work normally
Remediation:
* use [Troubleshooting](/Troubleshooting)
* retest with a known-good date range
### The plot generates but is not useful
Likely causes:
* the time range is too broad
* the incident window is wrong
* the operator is using the plot without corresponding log context
Isolation steps:
* rerun the plot for a tighter window
* compare the time window against user reports and logs
Remediation:
* narrow the range
* correlate with [Security Logs](/Security_Logs) and [Reporting Module](/Reporting_Module)
## Related controls / next steps
* Use [Troubleshooting](/Troubleshooting) if the plotting workflow fails.
* Use [Reporting Module](/Reporting_Module) for transaction-level evidence alongside the performance view.
* Use [Security Logs](/Security_Logs) when you need exact event correlation rather than only trend visualization.
## Related topics
- [Audit & Forensics](/use_cases/audit_and_forensics/audit_forensics.md)
- [Unable to Generate Performance Plot](/troubleshooting/not_generating_performance_plot.md)
- [Performance Accelerators](/use_cases/performance_acceleration/performance_accelerators.md)
- [Security Logs](/use_cases/audit_and_forensics/security_logs.md)
- [FAQs](/faqs/faqs.md)
This helps with later comparison, escalation, and post-incident review.
## Verification and validation
### Positive test
Generate a plot for a known busy period.
Expected result:
* the plot renders successfully
* the chosen time window matches the requested period
* the output is usable for operational review
### Negative test
Generate a plot for a quiet period or a very narrow window with little traffic.
Expected result:
* the plot still renders
* low activity is visible as low activity, not as a tool failure
### Evidence to retain
* the selected time range
* the saved plot file
* any related incident ticket or change reference
## Troubleshooting guide
### The plot does not generate
Likely causes:
* the plotting dependency or script path is broken
* the selected range has a tooling or data issue
Isolation steps:
* compare the behavior against the dedicated troubleshooting runbook
* verify whether other support functions work normally
Remediation:
* use [Troubleshooting](/Troubleshooting)
* retest with a known-good date range
### The plot generates but is not useful
Likely causes:
* the time range is too broad
* the incident window is wrong
* the operator is using the plot without corresponding log context
Isolation steps:
* rerun the plot for a tighter window
* compare the time window against user reports and logs
Remediation:
* narrow the range
* correlate with [Security Logs](/Security_Logs) and [Reporting Module](/Reporting_Module)
## Related controls / next steps
* Use [Troubleshooting](/Troubleshooting) if the plotting workflow fails.
* Use [Reporting Module](/Reporting_Module) for transaction-level evidence alongside the performance view.
* Use [Security Logs](/Security_Logs) when you need exact event correlation rather than only trend visualization.
## Related topics
- [Audit & Forensics](/use_cases/audit_and_forensics/audit_forensics.md)
- [Unable to Generate Performance Plot](/troubleshooting/not_generating_performance_plot.md)
- [Performance Accelerators](/use_cases/performance_acceleration/performance_accelerators.md)
- [Security Logs](/use_cases/audit_and_forensics/security_logs.md)
- [FAQs](/faqs/faqs.md)