Reporting (Dashboard)

From Secure Web Gateway

Overview

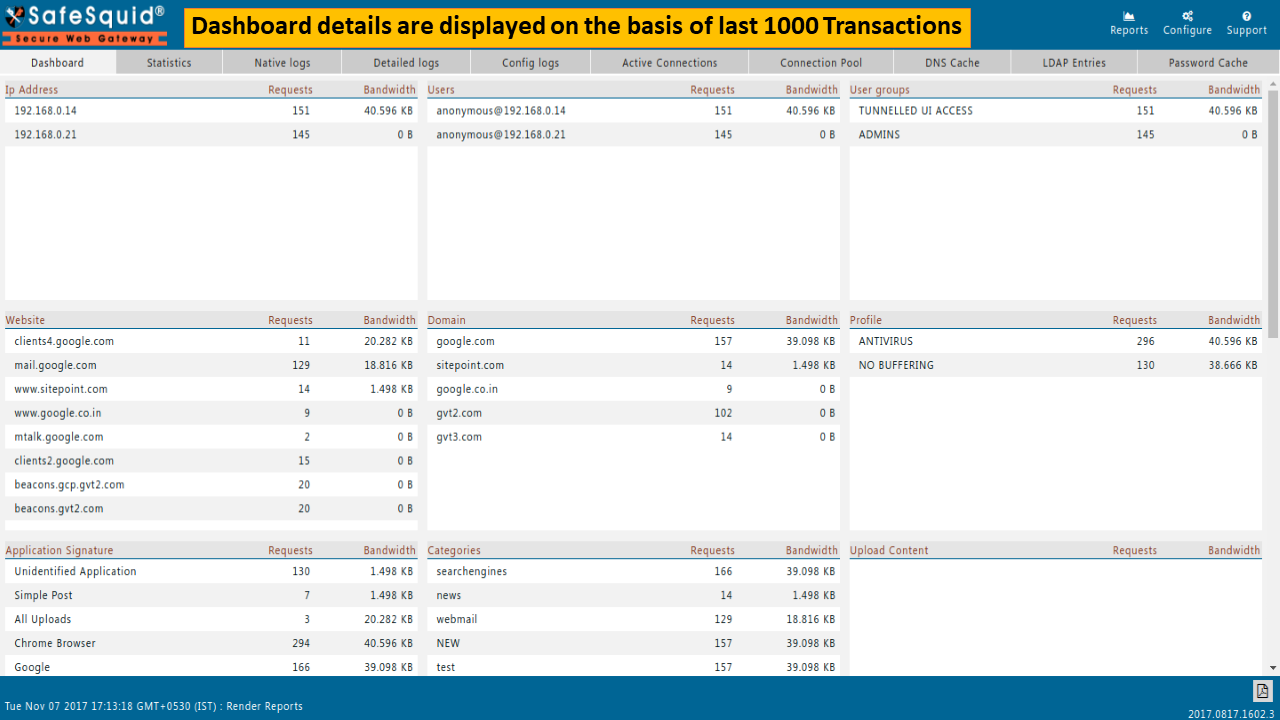
SafeSquid gives you the ultimate visibility into your activities with detailed real-time reporting.SafeSquid Dashboard allows you to get real-time traffic running on your network (Internet Usage intelligence) as well as bandwidth utilization and total number of requests. The dashboard information is obtained from SafeSquid databases and you can support direct access to the database for querying and analytics.

SafeSquid provides you report based on last 1000 transactions by default.SafeSquid also provides you report based on date range.SafeSquid also provide you the customize facility in last transaction as well as date range.
The dashboard displays the following activities based on last 1000 transactions:

  • IP Address
  • User Name
  • User Group
  • Websites
  • Domains
  • Profiles
  • Application Signature
  • Categories
  • Upload Content
  • Download Content11.Time Profiles
  • Block Websites
  • Security Breaches
  • Connection Failed
  • DNS Failed
  • Bypass Websites


Reporting-Dashboard (1).PNG


Drilling Method

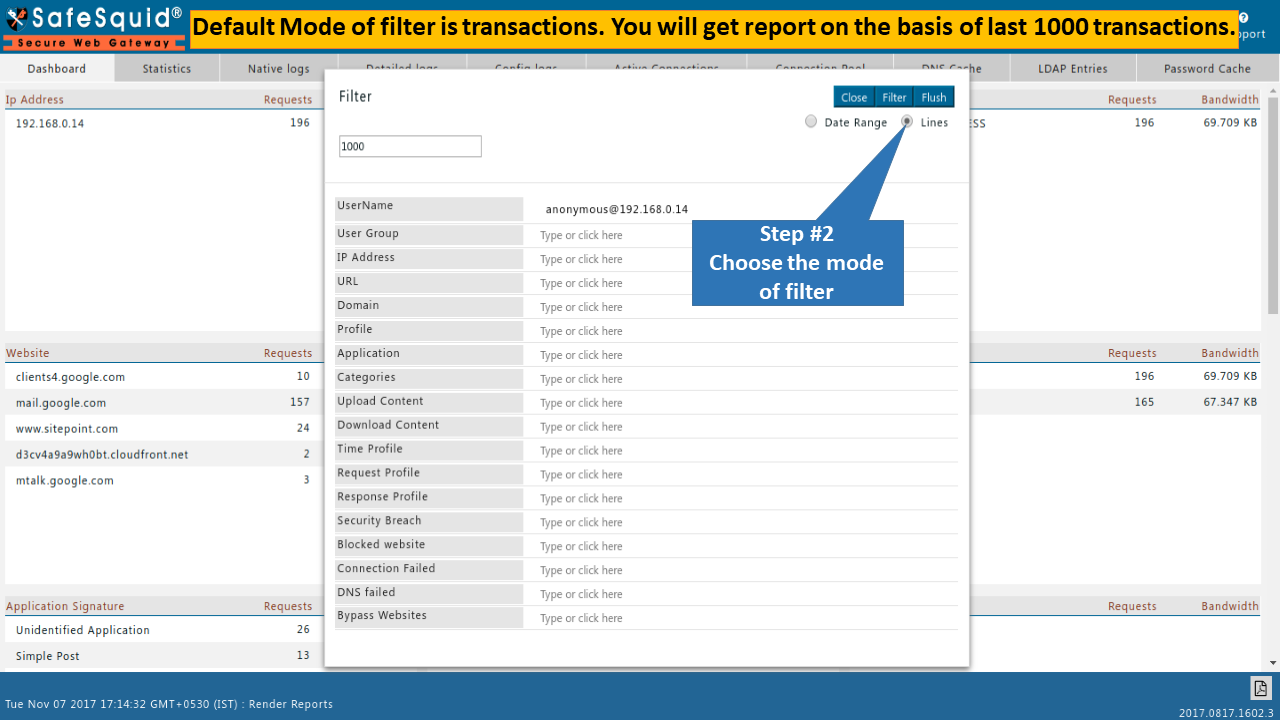
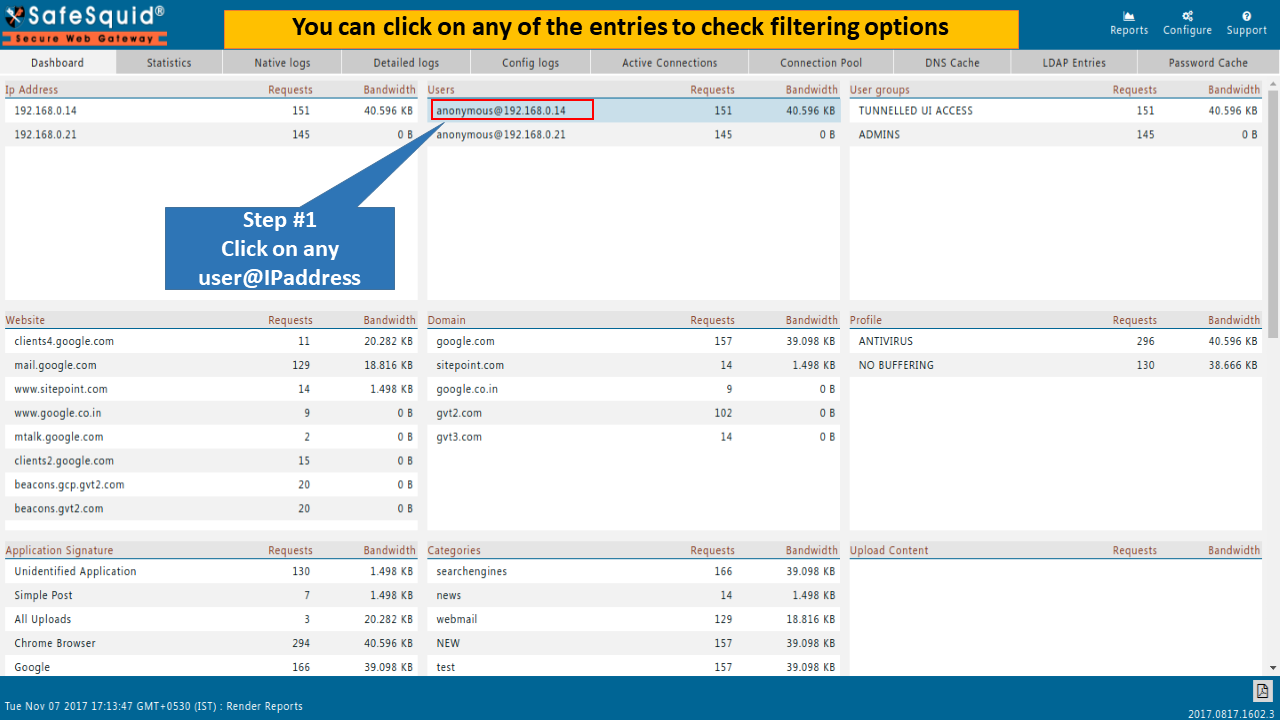
You can click on any of the entries to verify filtering option.

In given example we drilled out 

User Name: "anounymous@192.168.0.14"
Reporting-Dashboard (2).PNG


Transactions


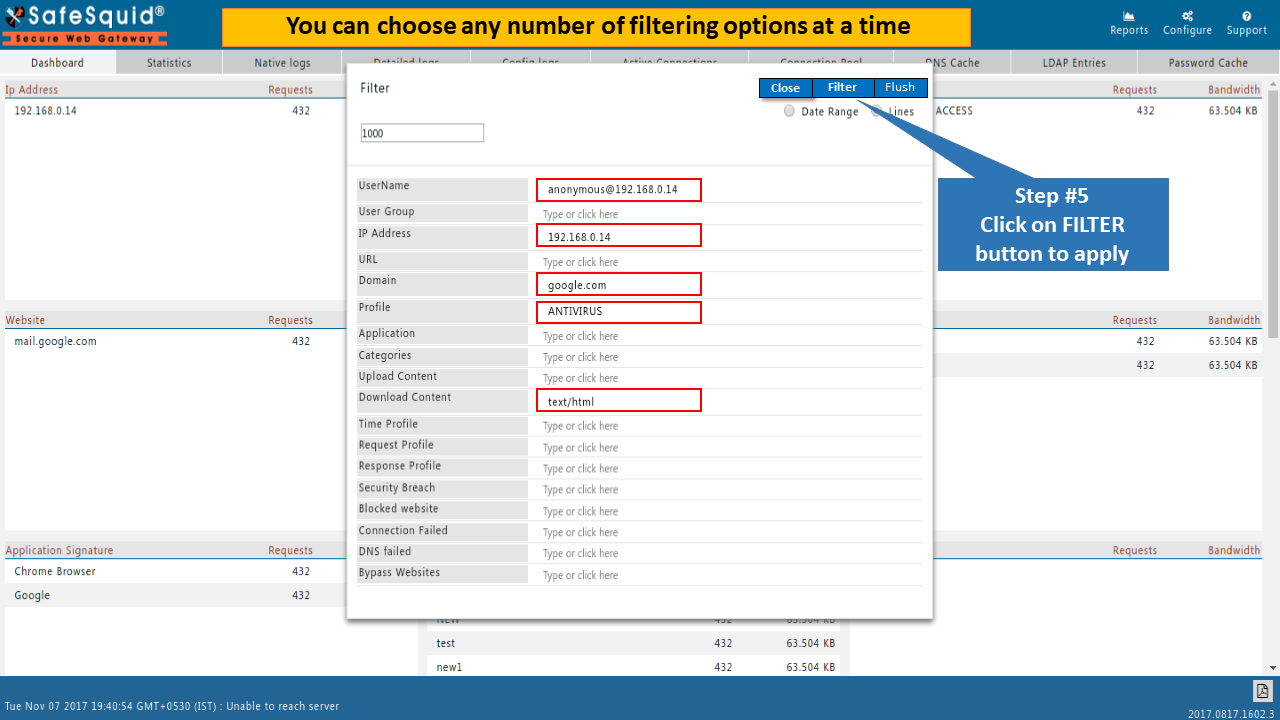
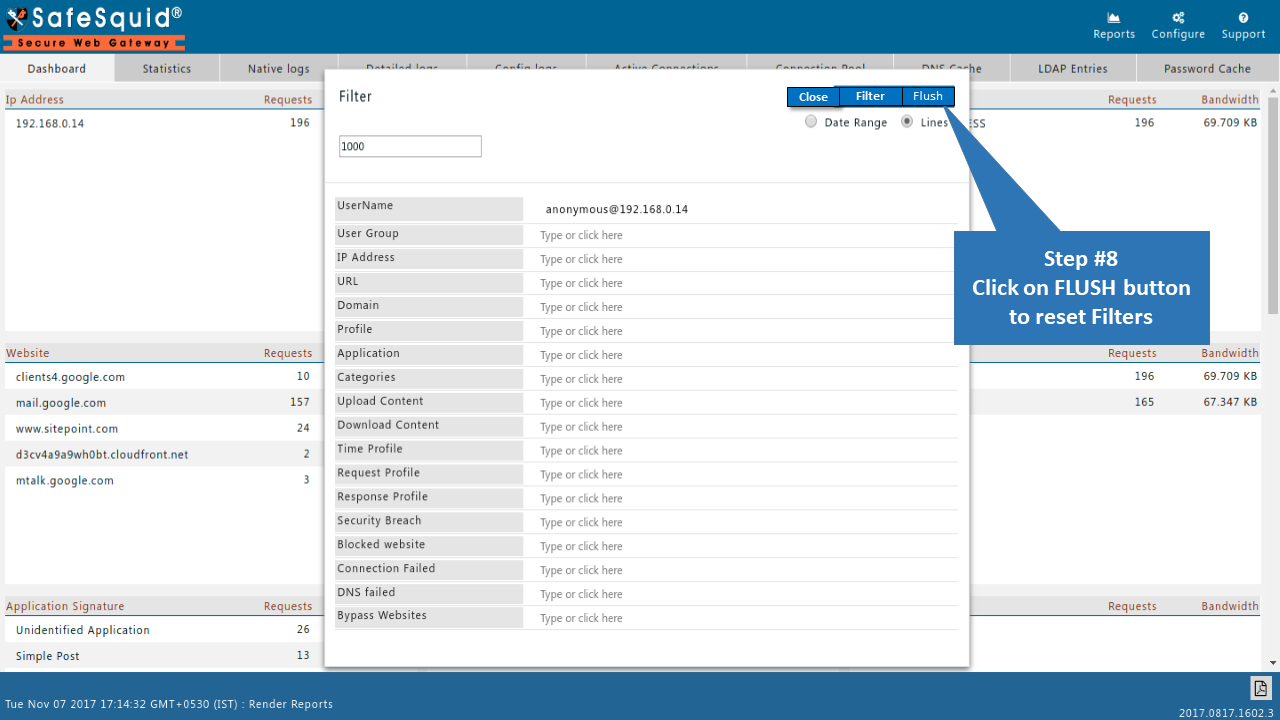
SafeSquid provides you report based on last 1000 transactions by default.
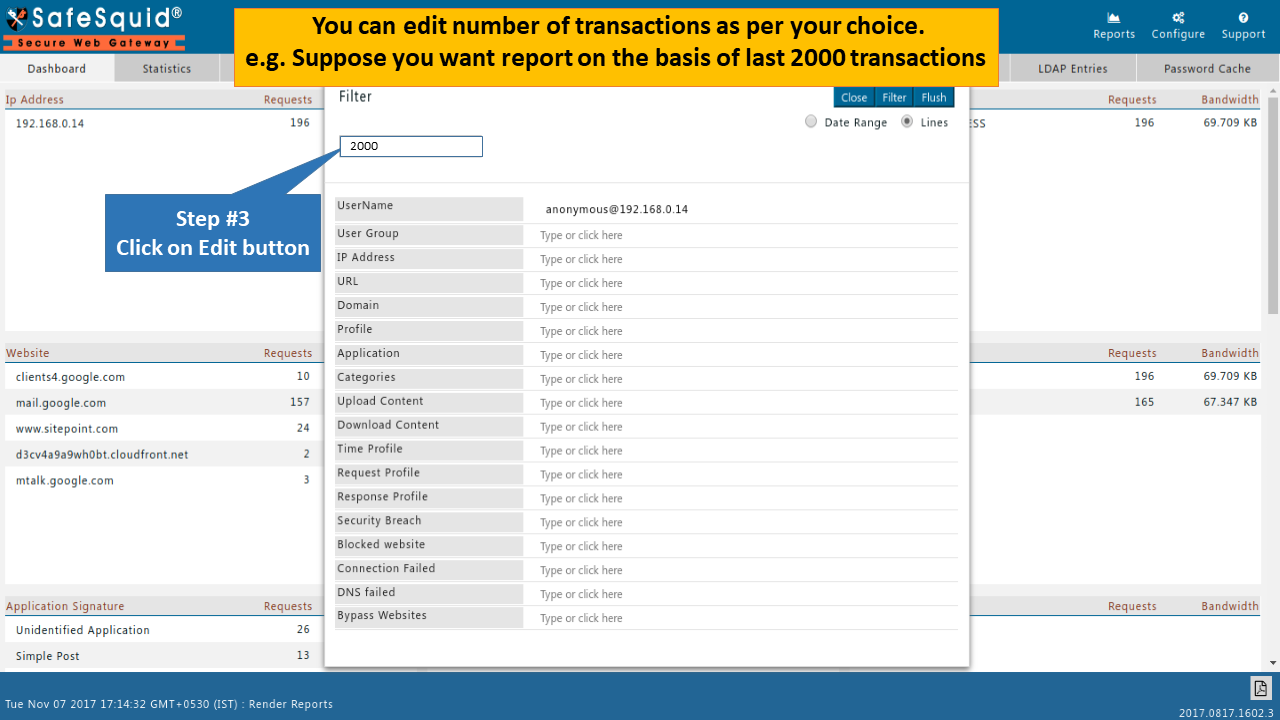
SafeSquid also provide you the facility for customized report.
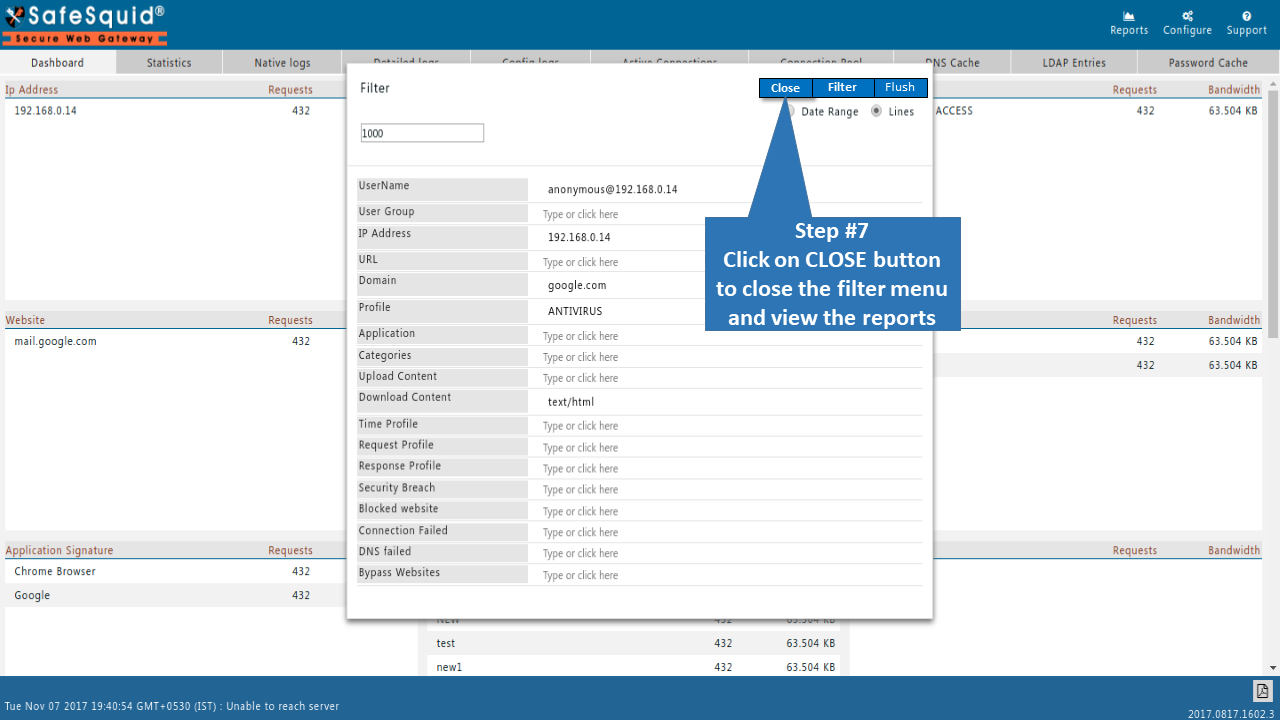
You should edit number of transactions as per your requirement for drilling purpose.


Reporting-Dashboard (3).PNG


Reporting-Dashboard (4).PNG


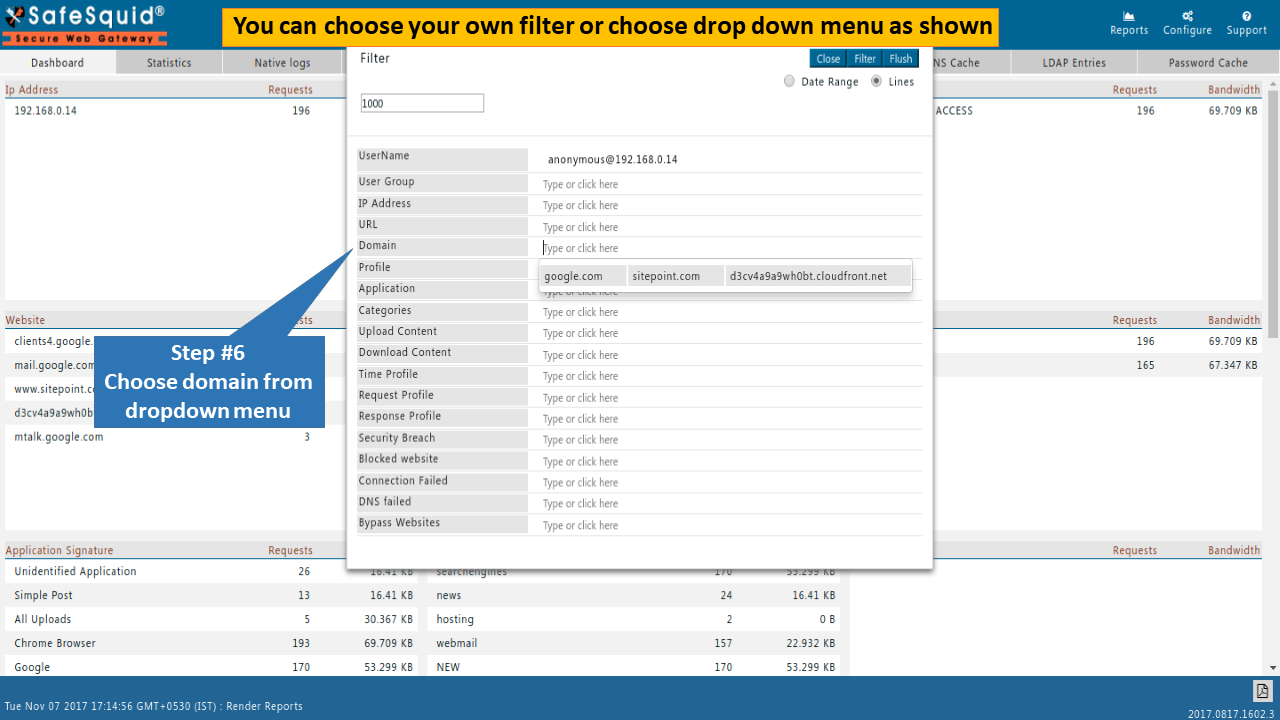
Reporting-Dashboard (6).PNG


Reporting-Dashboard (7).PNG


Reporting-Dashboard (8).PNG
 

Date Range


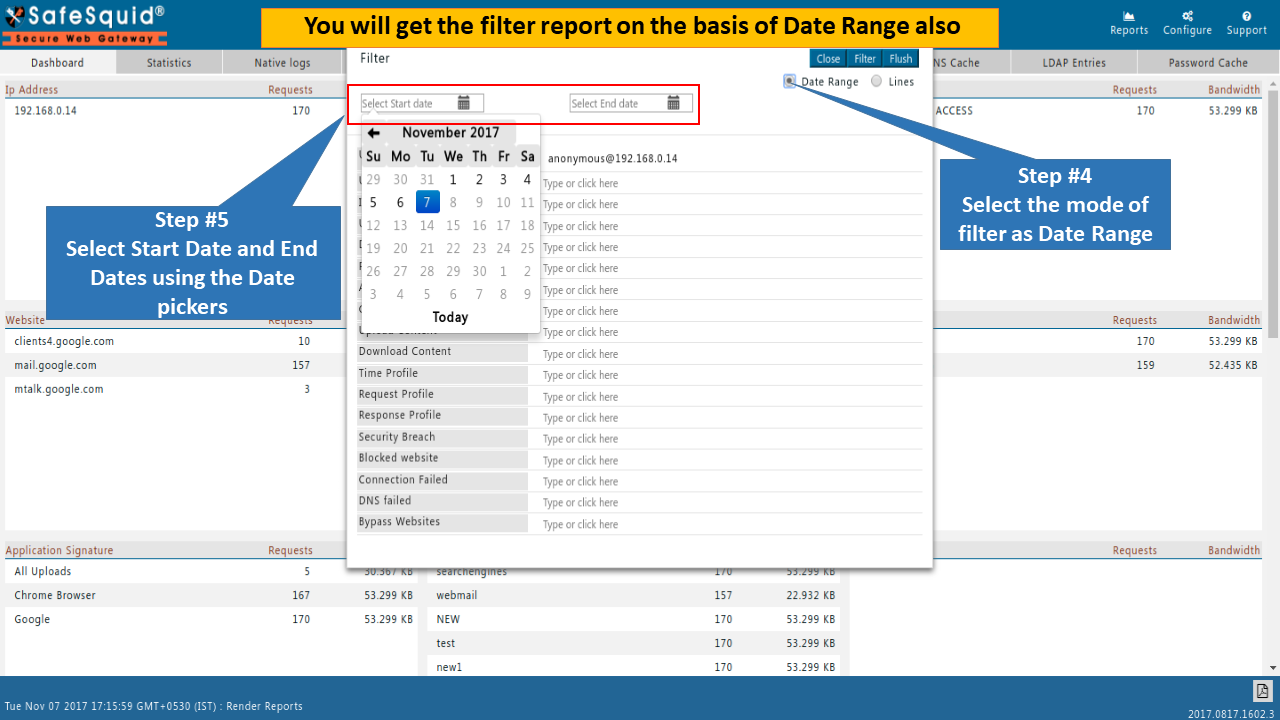
SafeSquid also provides you report based on date range.
You should filter your report by selecting start date and end date as per your requirement.


Example: Suppose you want report of 20 February 2018 in between 1PM to 2PM

Select Start date as 20 along with time as 1PM and make sure you should select year 2018.
Select End date as 20 along with time as 2PM and make sure you should select year 2018.
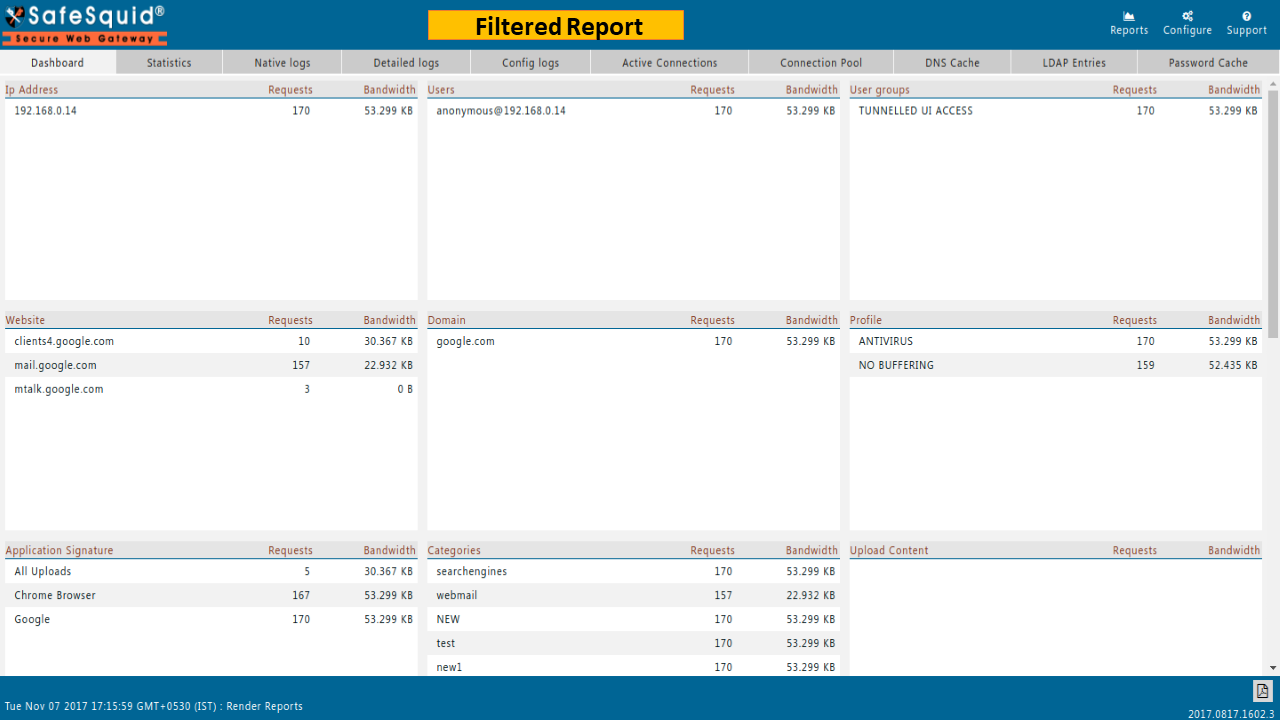
As soon as you select both the dates you should get drilled/filtered report in the background on dashboard.
You should click on close button for analyzing drilled report.


Reporting-Dashboard (5).PNG
 
Reporting-Dashboard (9).PNG


Reporting-Dashboard (10).PNG