Use Statistics To View SafeSquid Stats
Here's an interesting feature that SafeSquid provides the users to get some useful information regarding SafeSquid statistics.
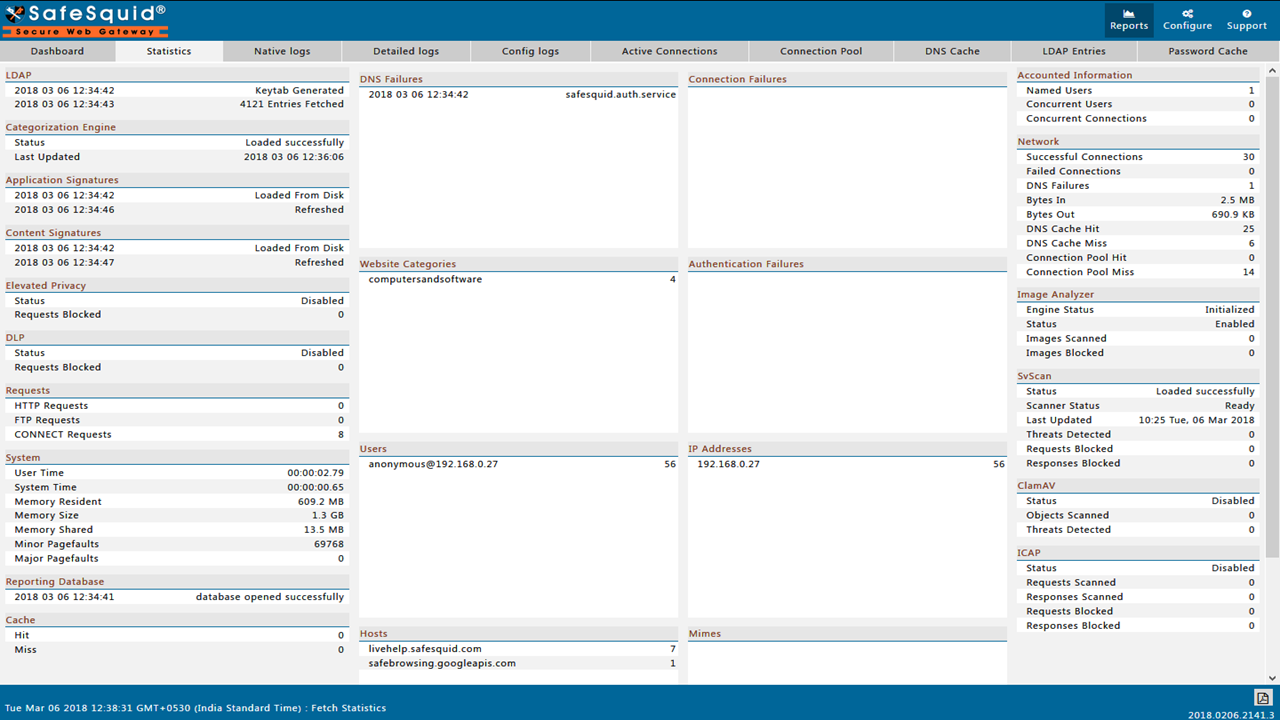
Statistics is one of the key features of SafeSquid where we can have a brief idea of what's going right and what's going wrong. You can view the statistics page by accessing the SafeSquid's web interface (http://safesquid.cfg/) and clicking on Statistics. You will be able to see list of items on the page as shown in the below screen shot.

Lets consider a scenario of how this statistics page helps users to identify what's going wrong.
Consider you have SafeSquid integrated to your domain controller (AD) and authentication enabled. Now all your users are accessing the internet by providing their identity (credentials). Suddenly one user reports that his authentication is not successful and SafeSquid keeps on asking him credentials. So you can verify this from the Authentication Failures widget of Statistics.
If the user is really facing the issue, the IP address or the user name will be shown in the Authentication Failures widget as shown below. Then you can validate whether the entered password is valid or not by checking the credentials in Password Cache. To view the Password Cache, open SafeSquid interface and click on Password Cache. There you will be shown with the user names and the passwords put in by the users and whose authentication failed.
You can alternatively fire a ldapsearch with the user name and password found in the Password Cache and validate if it is right or not. If your ldapsearch is not successful, then probably your user might have his password expired.
Typical ldapsearch command for a user james added into a domain of 'corporate.local' can be fired as:
ldapsearch -h <IP of DC> -b <domain> -D <dc of user> -w password
Ex: ldapsearch -h 192.168.221.1 -b "dc=corporate,dc=local" -D "james@corporate.local" -w secret@123