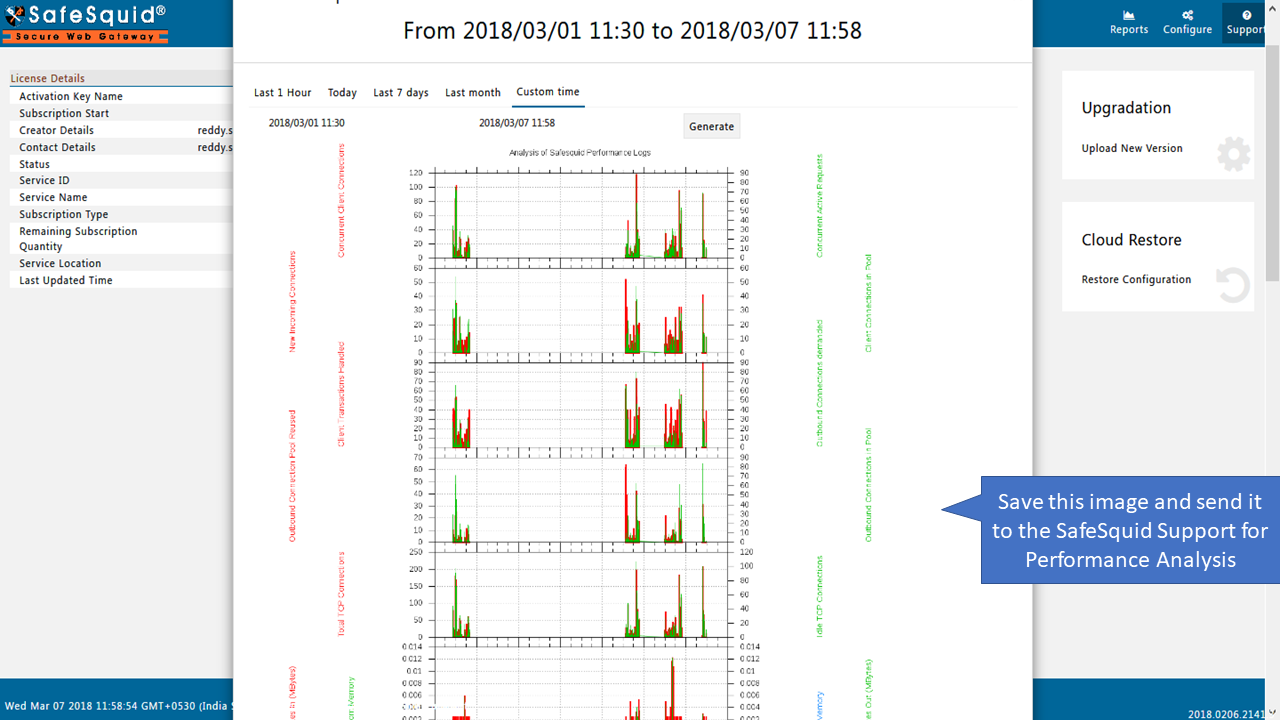
Generate Performance Plot from SafeSquid User Interaface
From Secure Web Gateway
Overview
This article helps you to understand, How to generate Performance plot from SafeSquid User Interface
Access The SafeSquid User Interface
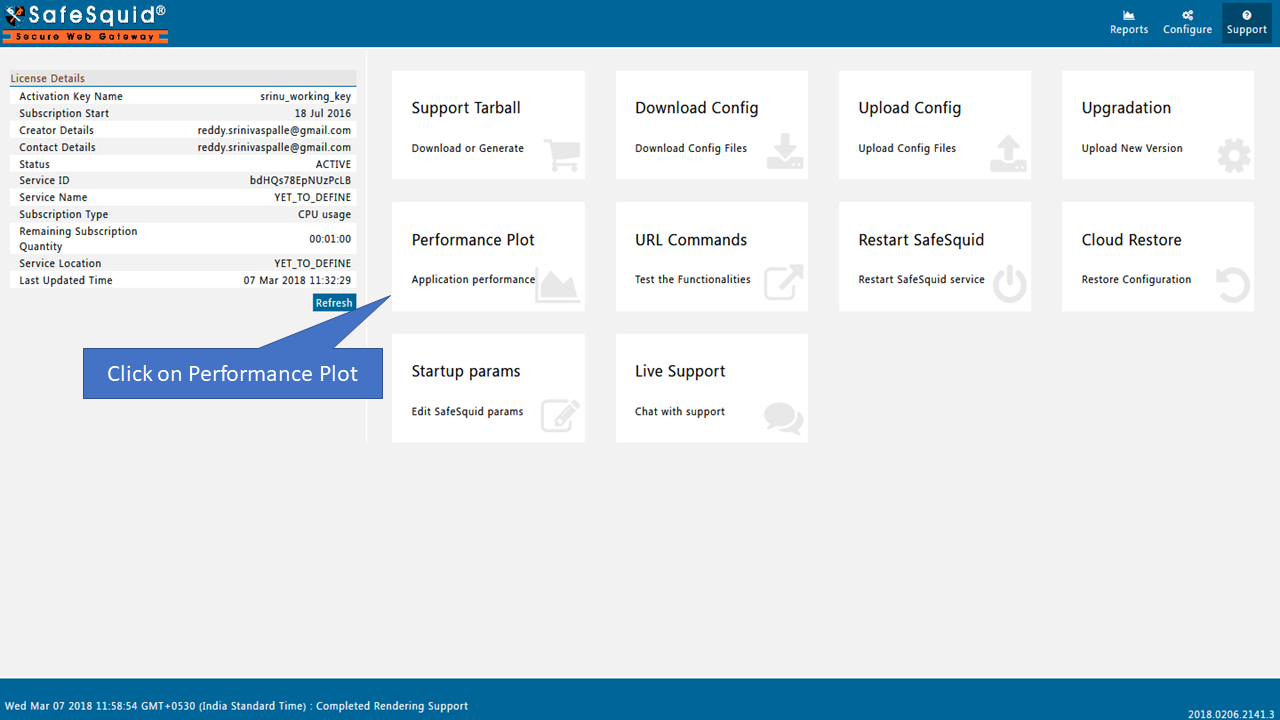
click on Support, you will see below page
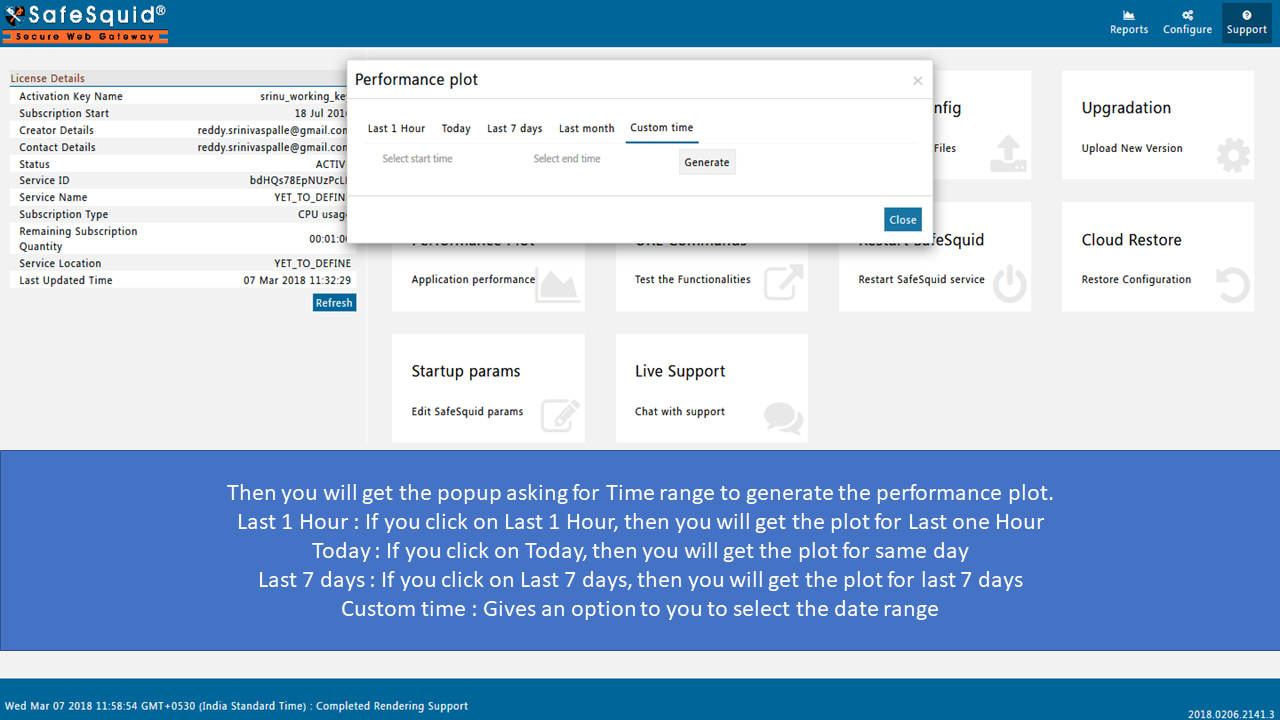
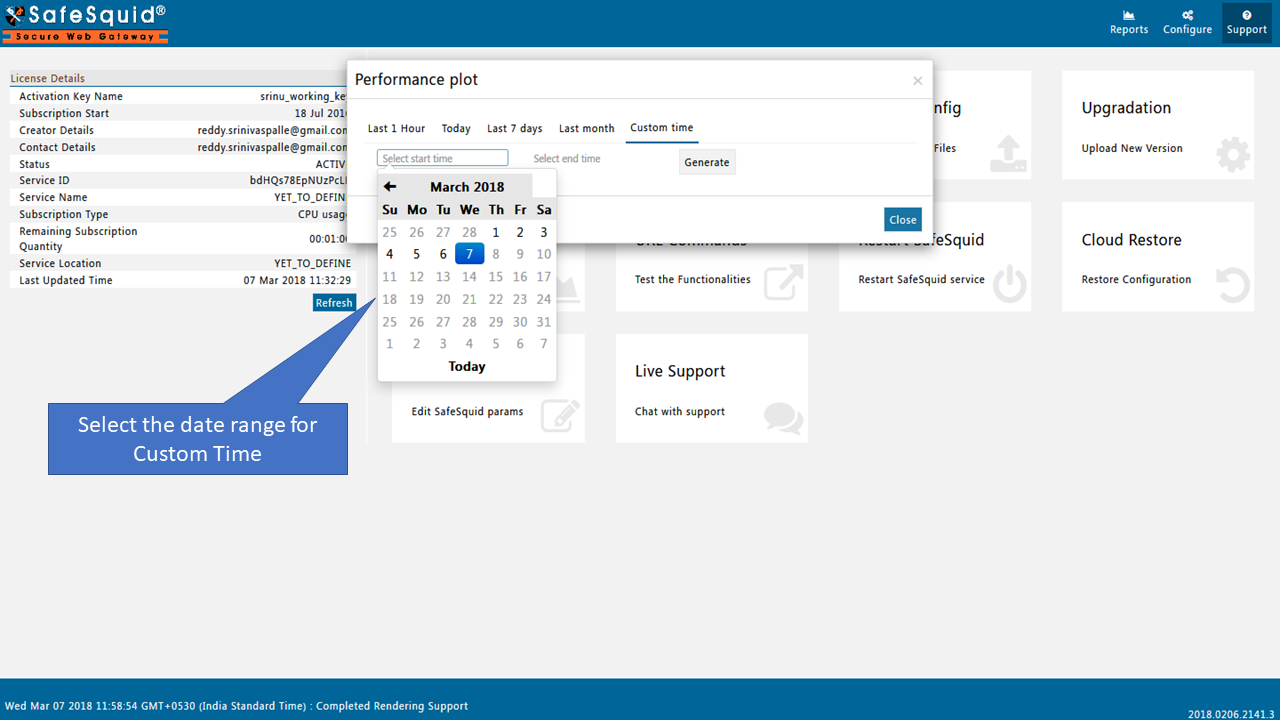
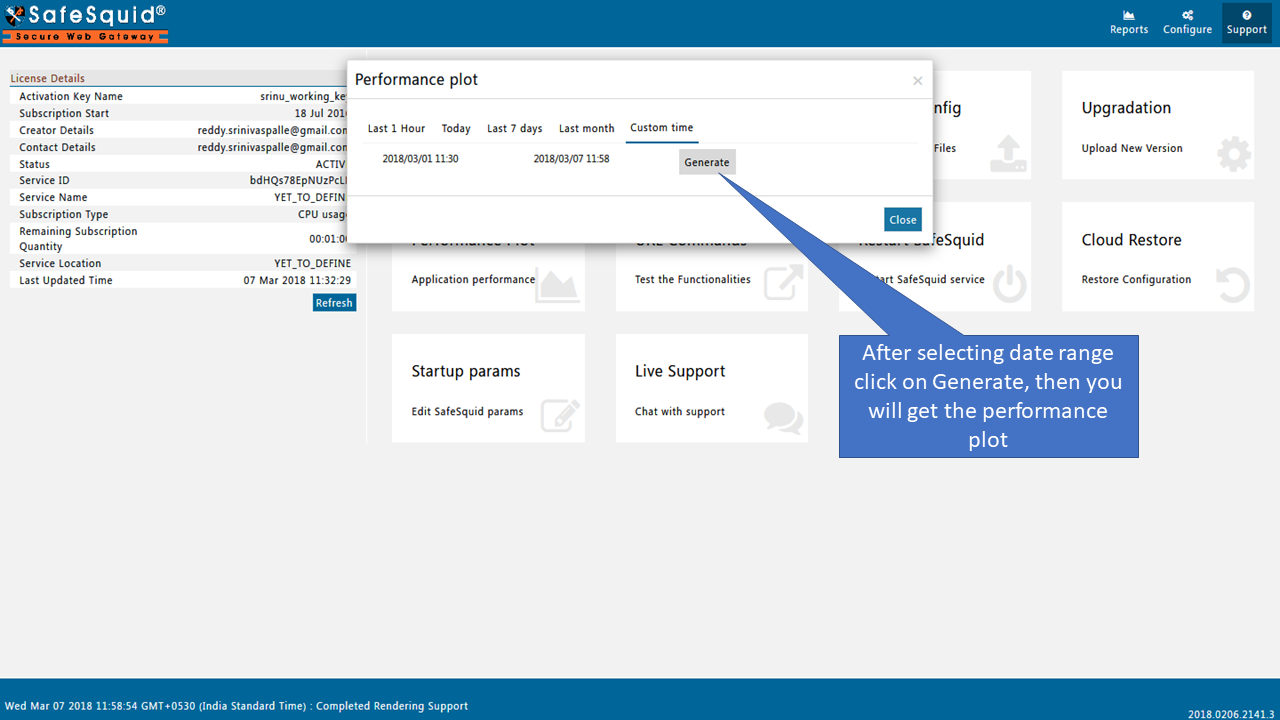
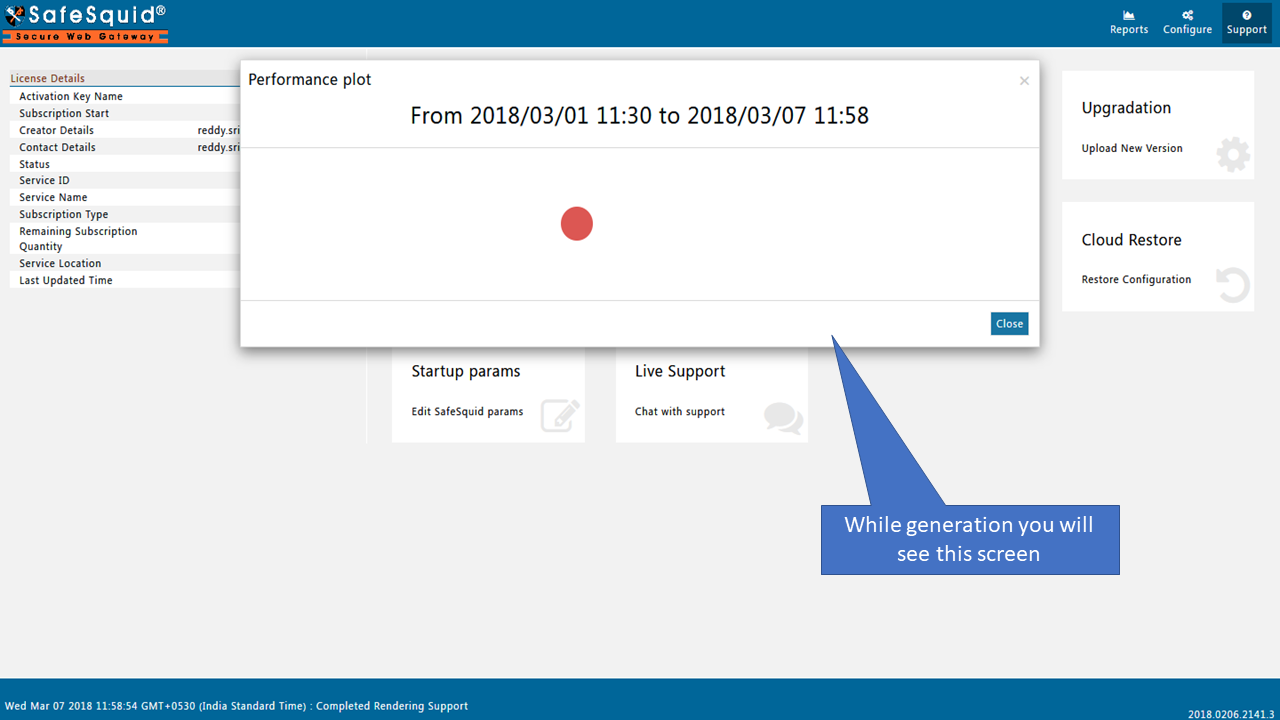
Generate Performance Plot
Save the Plot
