

Security Logs
Problem statement
If teams cannot tell which request was blocked, which request was bypassed, which configuration changed, or which user was involved, investigations become guesswork. Security logging is the evidence layer behind SafeSquid operations.Client scenario
Use this page when you need to understand which SafeSquid logs matter for:- request-level troubleshooting
- policy verification
- privileged-change review
- bypass and privacy-event review
- forensic evidence collection
Logs support troubleshooting and analysis
Logs provide a timeline of events for the OS and applications and are a primary troubleshooting tool. When an issue occurs, the system administrator analyzes log files first. Most logs are plain text under /var/log. With SafeSquid installed, two log types matter: SafeSquid application logs and SafeSquid activity logs (in system logs). To view a log file, use one of:SafeSquid Application Logs
SafeSquid application produces these logs. Logs contain all kinds of error messages, warnings or other events written by the SafeSquid. These messages provide logical, high-level information for specific use cases. Each log message helps administrators understand SafeSquid behavior. SafeSquid application generates six different log formats. These logs are named safesquid.log (Native logs), extended.log (NCSA/Extended logs), config.log (Config logs), and performance.log (Performance logs). Two more log formats were added subsequently as bypass.log and privacy.log. The path to these log files are as follows:
View Native Log and Config Log details from the SafeSquid Interface.
These log families map closely to the wider SafeSquid evidence model:
- native logs for functional and debugging detail
- extended logs for request-level evidence
- config logs for administrative changes
- performance logs for capacity and stability analysis
- bypass logs for override behavior
- privacy logs for privacy-related handling
Native logs
It records various functional aspects like REQUESTS, SECURITY, REDIRECT etc. that are affected by the various features and their configuration. Control the verbosity of the Native log by specifying LOGLEVEL, as shown in the table below. The LOGLEVEL parameter affects only the SafeSquid’s Native log.
To record only requests set LOGLEVEL to 1; to record only caching set LOGLEVEL to 2048. To record rewriting, limits, and forwarding set LOGLEVEL to 512 + 1024 + 16384 (17920). To log everything (risk: very large log file quickly) set LOGLEVEL to the sum of all values in the table, 134217727—also the default if LOGLEVEL is commented out. For debug logs only set LOGLEVEL to 134217728. For all activities plus debug set LOGLEVEL to 268435455.
:::note
Adjusting this value requires a restart of SafeSquid service.
:::
This file stored all data related to every request and response processed by the SafeSquid. These logs will be useful for debugging purpose.
Access the SafeSquid User Interface
On top right of Safesquid Interface view Reports >> Dashboard
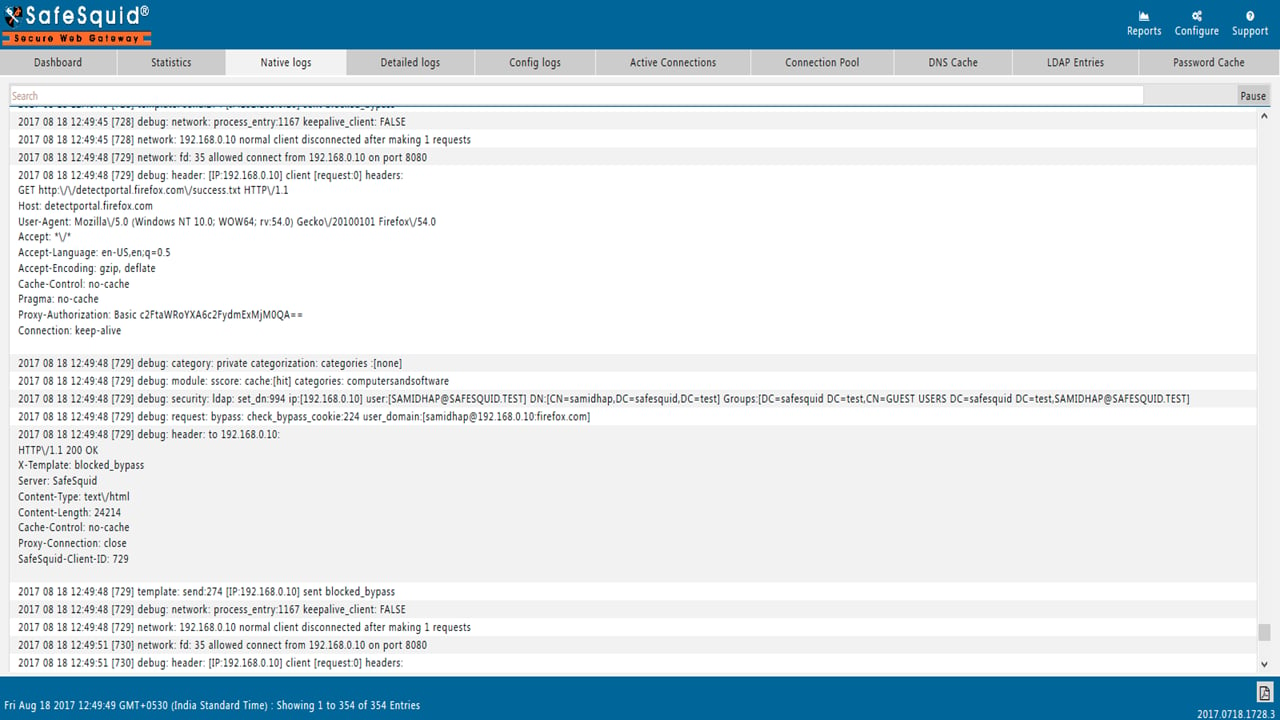
Click on “Native logs” to see the run time native logs.
Each request and response processed through SafeSquid is visible. Use the search bar to find a particular string. The Resume button stops real-time streaming of logs.
Extended logs
The extended.log (NCSA / Extended log format) records maximum details of each request handled by the proxy application. Extended logs will be helpful for generation of reports to analyze the user activities. FORMAT / LEGEND: “record_id” “client_id” “request_id” “date_time” “elapsed_time” “status” “size” “upload” “download” “bypassed” “client_ip” “username” “method” “url” “http_referer” “useragent” “mime” “filter_name” “filtering_reason” “interface” “cachecode” “peercode” “peer” “request_host” “request_tld” “referer_host” “referer_tld” “range” “time_profiles” “user_groups” “request_profiles” “application_signatures” “categories” “response_profiles” “upload_content_types” “download_content_types” “profiles” Example Log Line1:
On top right of Safesquid Interface view Reports >> Dashboard
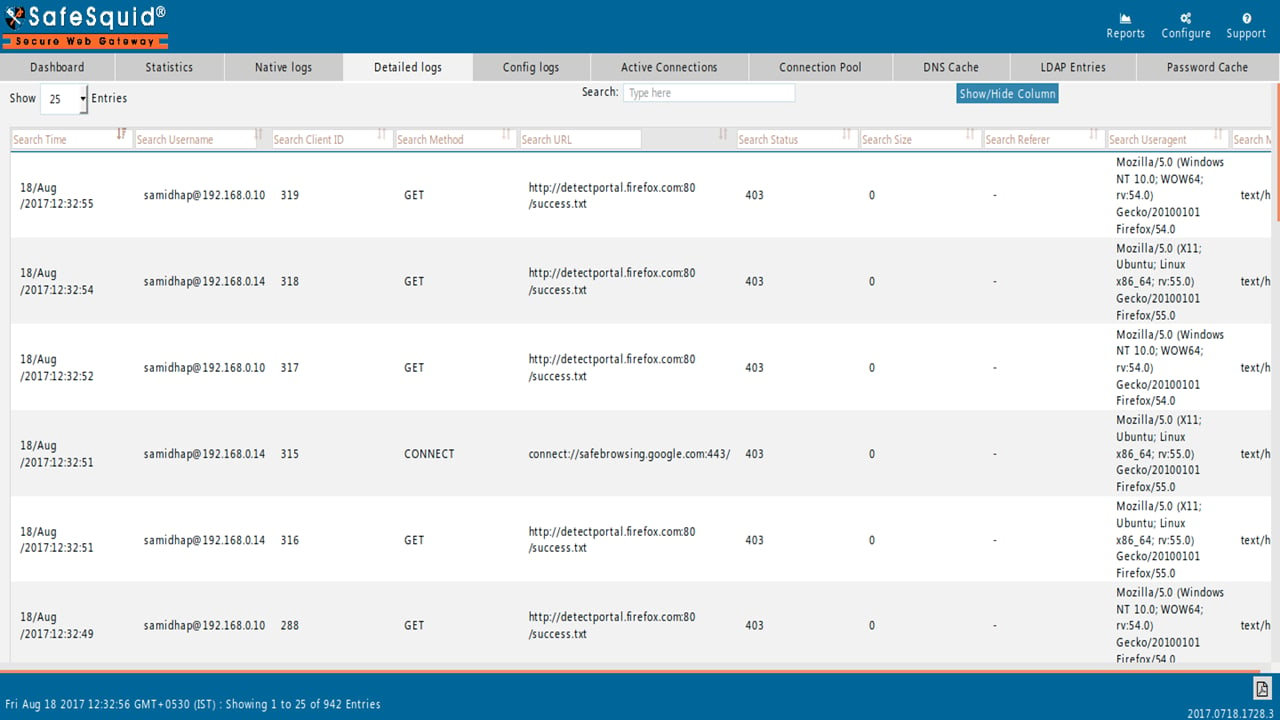
Click on “Detailed logs” to see the run time extended logs.
Run time detailed logs displayed are Time, Username, Client ID, Method, URL, Status, Size, Referer, Useragent, Mime, Filter Name, Filter Reason, Profiles, Request profiles, Response profiles, Categories, Applications, Upload content type, Download content type from Extended Logs.
You can use search option to find information related to specific user or specific response code…etc. It’s a common search option for filtering.
Show/Hide Column button is for hiding any option from above list.
You can also search individually from above list.
Config logs
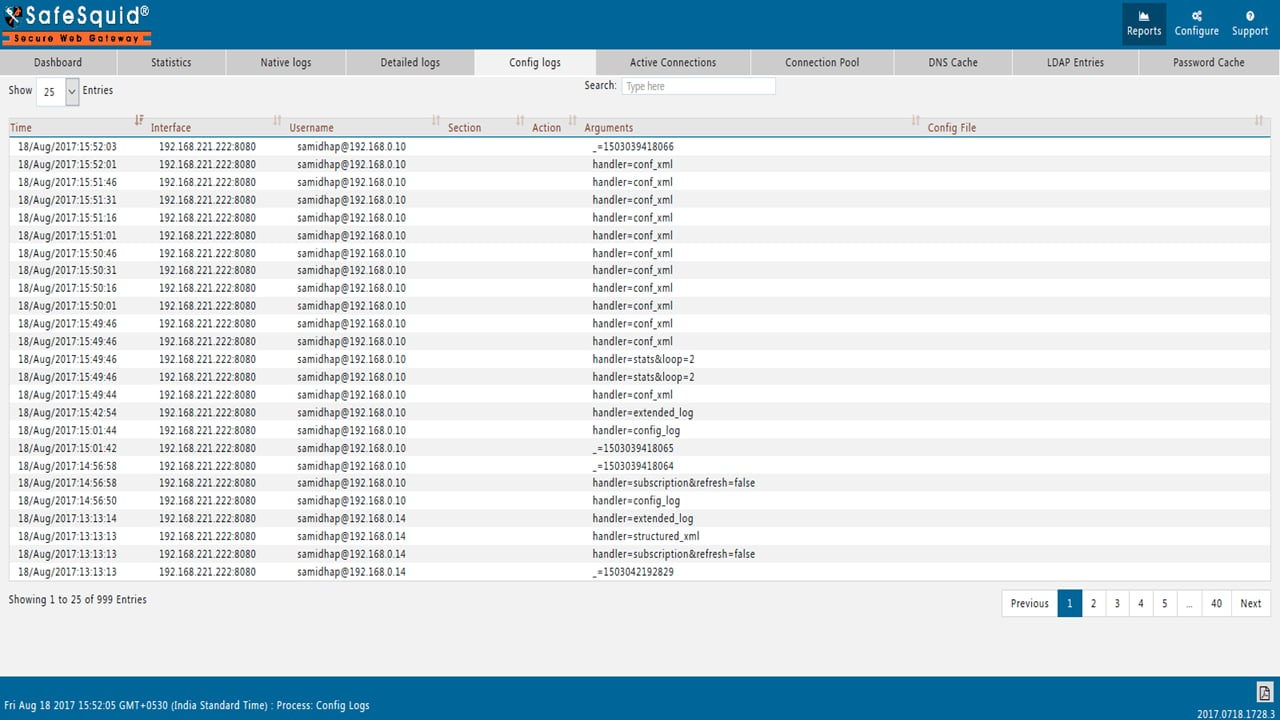
Config logs contain the details related to the SafeSquid user interface activities like configuration change. You can find the users information who made the configuration changes and when. FORMAT / LEGEND: “ACCESS_TIME” “SAFESQUID_INTERFACE” “USERNAME@IP” “PAGE” “SECTION” “ACTION” “HTTP_METHOD” “URL” “REFERER” “ARGUMENTS” “CONFIG_FILE” “REASON” Example Log Line1:
On top right of Safesquid Interface view Reports >> Dashboard
Click on “Config logs”
You can use search option to find information related to specific Time, Interface, Username, Section, Action, Arguments, Config File.
Performance logs
Performance logs will be helpful to analyze the performance of SafeSquid. SafeSquid Performance logs provide performance metrics to identify any outage due to resource shortfall, or failure in Internet Connectivity, or surge in web-traffic, etc. SafeSquid performance log has been extended to make it easier for analysis with third-party software such as GNU Plot that analyzes records on a progressive per line basis. FORMAT / LEGEND: Time Stamp (YYYYMMDDhhmmss),Elapsed Time,Client Connections Handled,Client Connections Closed,Client Transactions Handled,Client Connections in Pool,Spare Client Threads,Client Threads in Use,Client Threads in Waiting,Threads Starting up,Threads Reserved for Prefetching,Threading Errors,Outbound Connections created,Outbound Connections Failed,Outbound Connection Pool Reused,Outbound Connections in Pool,Bytes in (KBytes),Bytes Out (KBytes),Caching Objects Created in Memory,Caching Objects Removed from Memory,DNS Queries Reused,New DNS Queries,DNS Query failures,Total System Memory (KBytes),Free System Memory (KBytes),SafeSquid Virtual Memory (KBytes),SafeSquid Resident Memory (KBytes),SafeSquid Shared Memory (KBytes),SafeSquid Code Memory (KBytes),SafeSquid Data Memory (KBytes),SafeSquid Library Memory (KBytes),Connections Handled Delta,Connections Closed Delta,Transactions Handled Delta,Client Pool Delta,Spare Threads Delta,Active Threads Delta,Threads Waiting Delta,Threads Starting up Delta,Threads Prefetching Delta,Threading Errors Delta,Outbound Connections created Delta,Outbound Connections Failed Delta,Outbound Connection Pool Reused Delta,Outbound Connections in Pool Delta,Bytes in (KBytes) Delta,Bytes Out (KBytes) Delta,Caching Objects Created in Memory Delta,Caching Objects Removed from Memory Delta,DNS Queries Reused Delta,New DNS Queries Delta,DNS Query failures Delta,load avg.(1 min),load avg.(5 min),load avg.(15 min),Running Processes,Waiting Processes,User Time,System Time,Total (user + system) Time,User Time Delta,System Time Delta,Total Time Delta Example Log Line1:
Performance Plot
From the interface go to the Support page; open the Performance Plot tab, select two time intervals to generate the performance plot for that range.
See More about How to generate the Performance Plot
Bypass logs
Bypass logs contain the details related to the execution of bypass privilege granted to any user. When users with bypass privilege, execute their privilege to access a web-site that is not explicitly allowed, it is recorded in the bypass logs. It also records the users’ opinions about the site, and the URLs that were additionally bypassed, to present a seamless experience. FORMAT / LEGEND: “TimeStamp” “Action” “User “Referrer.Domain” “Requested.Domain” “From/Referral/URL” “Method” “Requested/URL” “Categories,Applied” “Suggested,Categories” Example Log Line1:Privacy logs
Privacy Logs are used to record incidences of cookies, and queries going to third-party web sites. Privacy log captures incidences of third-party web-sites when a user accesses a web-site, and action taken by elevated privacy. FORMAT / LEGEND: YYYY/mm/DD:HH:MM:SS ClientID username@IP HTTP-REFERRER METHOD URL [USER_AGENT] action The details of the fields in privacy.log are as follows:SafeSquid activity log written in system logs
The path to these log files is as follows:Monit log
SafeSquid Uses Monit service for managing and monitoring its process. Monit service is particularly useful for monitoring daemon processes, such as those started at system boot time. While Monit service is running and if SafeSquid process is terminated either manually or automatically then SafeSquid will be restarted. Also, Monit service plays a crucial role when user want to modify any startup parameter or upgrade the SafeSquid version. FORMAT: [date] priority : message Example Log Lines: [IST Jan 20 13:08:37] info : ‘safesquid’ trying to restart [IST Jan 20 13:08:37] info : ‘safesquid’ start: /etc/init.d/safesquid [IST Jan 20 13:08:40] error : ‘safesquid.dns.conf’ timestamp was changed for /usr/local/safesquid/security/dns/safesquid.dns.conf [IST Jan 20 13:08:40] info : ‘safesquid.dns.conf’ exec: /bin/bash [IST Jan 20 13:08:40] error : ‘upgrade’ timestamp was changed for /tmp/safesquid/upgrade [IST Jan 20 13:08:40] info : ‘upgrade’ exec: /bin/bash [IST Jan 20 13:08:40] error : ‘safesquid.ldb’ file doesn’t exist [IST Jan 20 13:08:40] info : ‘safesquid.ldb’ trying to restart [IST Jan 20 13:08:43] error : ‘Logs’ space usage 86.9% matches resource limit [space usage>5.0%] [IST Jan 20 13:08:43] info : ‘safesquid’ process is running with pid 1815 [IST Jan 20 13:08:43] error : ‘named’ process PID changed from 1170 to 1891 [IST Jan 20 13:08:43] info : ‘safesquid.dns.conf’ timestamp was not changed for /usr/local/safesquid/security/dns/safesquid.dns.conf [IST Jan 20 13:08:43] info : ‘upgrade’ timestamp was not changed for /tmp/safesquid/upgradeSyslog
Linux’s syslog service provides a highly configurable logging system. Some messages triggered by SafeSquid application are been stored in syslog. Syslog is a standard log for sending and receiving notification messages—in a particular format—from various network devices. The messages include time stamps, event messages, severity, host IP addresses, diagnostics and more. Syslog was designed to monitor network devices and systems to send out notification messages if there are any issues with functioning—it also sends out alerts for pre-notified events and monitors suspicious activity via the change log/event log of participating network devices. You will find log lines of SafeSquid application in the syslog file. Example Log Lines: 2020 01 20 14:25:08 [-1] init: Startup Log: /var/log/syslog 2020 01 20 14:25:08 [-1] init: safesquid: start called 2020 01 20 14:25:08 [-1] init: USER: ssquid exists 2020 01 20 14:25:08 [-1] init: ssquid: checking for group membership: root 2020 01 20 14:25:08 [-1] init: ssquid: has group memberships: root 2020 01 20 14:25:08 [-1] init: ssquid: is member of group: root 2020 01 20 14:25:08 [-1] init: export MALLOC_CHECK_=2 2020 01 20 14:25:08 [-1] init: debug: invoking tcp_tune 2020 01 20 14:25:08 [-1] init: RAMDEVICE /dev/ram1 does not exist, and therefore cannot be used 2020 01 20 14:25:08 [-1] init: LIBS_DIR: /opt/safesquid/libs no preload libraries found 2020 01 20 14:25:08 [-1] init: validating: OPT_DIR:/opt/safesquid with permissions ug=rwX,o=r 2020 01 20 14:25:08 [-1] init: already exists: OPT_DIR:/opt/safesquid 2020 01 20 14:25:08 [-1] init: SET_PERMISSION: OPT_DIR:/opt/safesquid ug=rwX,o=r 2020 01 20 14:25:08 [-1] init: validating: USR_LOCAL_DIR:/usr/local/safesquid with permissions ug=rwX,o=r 2020 01 20 14:25:08 [-1] init: already exists: USR_LOCAL_DIR:/usr/local/safesquid 2020 01 20 14:25:08 [-1] init: SET_PERMISSION: USR_LOCAL_DIR:/usr/local/safesquid ug=rwX,o=r 2020 01 20 14:25:08 [-1] init: validating: TMP_DIR:/tmp/safesquid with permissions ug=rwX,o=r 2020 01 20 14:25:08 [-1] init: already exists: TMP_DIR:/tmp/safesquid 2020 01 20 14:25:08 [-1] init: SET_PERMISSION: TMP_DIR:/tmp/safesquid ug=rwX,o=r https://help.safesquid.com/portal/en/kb/articles/identify-the-filter-by-using-safesquid-extended-logs-or-detailed-logs https://help.safesquid.com/portal/en/kb/articles/identify-the-filter-name-using-safesquid-detailed-logs-from-the-interface https://help.safesquid.com/portal/en/kb/articles/forwarding-logs-to-the-siem-server-by-configuring-the-udp-portUse logs intentionally
When operators know which question they are answering, they can move to the right log family faster:- use
extended.logwhen you need user, URL, status, filter, profile, category, and application evidence for a specific transaction - use
safesquid.logwhen you need feature-level behavior and debugging detail - use
config.logwhen you need to know what changed and when - use
performance.logwhen the problem is latency, load, or resource pressure - use
bypass.logwhen a blocked request appears to have been overridden - use
privacy.logwhen privacy controls, cookie handling, or third-party requests are under review - use
/var/log/monit.logand/var/log/syslogwhen the issue may be service health, startup, or host-level behavior
Verification and validation
Positive test
Trigger a controlled policy event, such as a known block, bypass, or login-authenticated request, then verify that:- the event appears in the expected log family
- the username, client IP, URL, and status line up with the test
- the applied filter or profile matches the intended policy path
Negative test
Run a normal allowed request that should not trigger a block, bypass, or privacy event. Expected result:- the request appears in the normal request evidence path
- no misleading bypass or filter event is recorded
Audit evidence
For investigation and audit readiness, retain:- the exact time window used for the search
- the username or client IP
- the URL or domain involved
- the filter, profile, category, or application fields that justify the decision
- related
config.logentries when a policy change may have caused the observed behavior
Troubleshooting guide
Operators cannot find a request that users insist happened
Likely causes:- the wrong time window is being searched
- the traffic bypassed the expected SafeSquid path
- the wrong log family is being checked
- confirm the client IP, username, and approximate timestamp
- search
extended.logfirst for request evidence - verify the client was actually using SafeSquid during the incident
- narrow the time range and search by URL, user, and status
- investigate bypass paths or alternate egress
- preserve the exact search criteria once the event is found
A request was blocked, but the team cannot tell why
Likely causes:- only status codes are being reviewed
- the filter and profile fields were not checked
- a recent configuration change altered behavior
- inspect
extended.logforfilter_name,filtering_reason, and applied profiles - inspect
config.logfor recent rule changes - compare the event against a known-good earlier transaction
- document the exact filter path that triggered
- rollback or adjust the offending configuration if needed
- retest the same URL or payload
Logging exists, but evidence is too thin for incident review
Likely causes:- teams rely only on summary views
- log retention or forwarding is incomplete
- verbose logging was disabled during the incident window
- confirm which raw log files were available during the event
- confirm whether SIEM forwarding captured the same period
- review whether the selected log level supported the needed detail
- preserve raw logs for the affected window
- improve forwarding and retention coverage
- adjust logging strategy for future investigations, then validate with a fresh test
Related controls / next steps
- Use Reporting Module for operational dashboards and exported evidence.
- Use Monit when service-restart events and local watchdog health are part of the investigation.